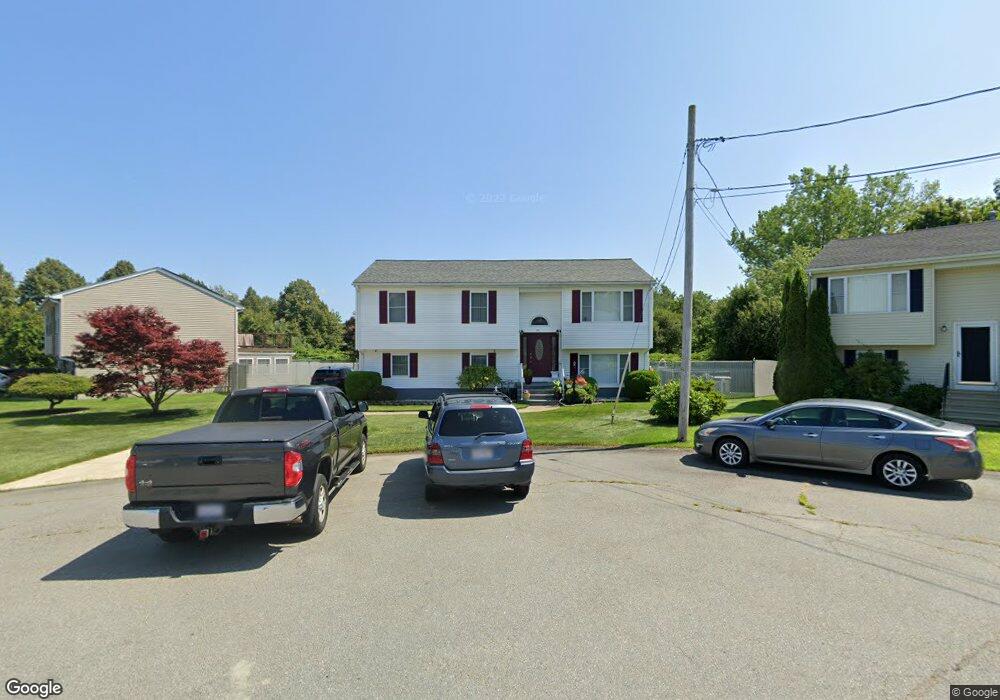
45 Watson Way Fall River, MA 02721
Maplewood NeighborhoodEstimated Value: $563,000 - $803,000
5
Beds
2
Baths
2,186
Sq Ft
$290/Sq Ft
Est. Value
About This Home
This home is located at 45 Watson Way, Fall River, MA 02721 and is currently estimated at $634,479, approximately $290 per square foot. 45 Watson Way is a home located in Bristol County with nearby schools including Henry Lord Community School, B M C Durfee High School, and Argosy Collegiate Charter School.
Ownership History
Date
Name
Owned For
Owner Type
Purchase Details
Closed on
Feb 13, 2020
Sold by
Bonanca Natalia
Bought by
Moniz Maria F
Current Estimated Value
Purchase Details
Closed on
Oct 9, 2012
Sold by
Martins Gilberto O and Martins Maria F
Bought by
Martins Maria F
Home Financials for this Owner
Home Financials are based on the most recent Mortgage that was taken out on this home.
Original Mortgage
$62,000
Interest Rate
3.66%
Mortgage Type
New Conventional
Purchase Details
Closed on
Aug 6, 1996
Sold by
Well Built Homes Inc
Bought by
Martins Gilbert O
Create a Home Valuation Report for This Property
The Home Valuation Report is an in-depth analysis detailing your home's value as well as a comparison with similar homes in the area
Home Values in the Area
Average Home Value in this Area
Purchase History
| Date | Buyer | Sale Price | Title Company |
|---|---|---|---|
| Moniz Maria F | -- | None Available | |
| Martins Maria F | -- | -- | |
| Martins Gilbert O | $135,000 | -- |
Source: Public Records
Mortgage History
| Date | Status | Borrower | Loan Amount |
|---|---|---|---|
| Previous Owner | Martins Maria F | $62,000 | |
| Previous Owner | Martins Gilbert O | $95,000 | |
| Previous Owner | Martins Gilbert O | $22,000 |
Source: Public Records
Tax History
| Year | Tax Paid | Tax Assessment Tax Assessment Total Assessment is a certain percentage of the fair market value that is determined by local assessors to be the total taxable value of land and additions on the property. | Land | Improvement |
|---|---|---|---|---|
| 2025 | $6,815 | $595,200 | $121,800 | $473,400 |
| 2024 | $6,249 | $543,900 | $119,400 | $424,500 |
| 2023 | $5,698 | $464,400 | $107,600 | $356,800 |
| 2022 | $5,223 | $413,900 | $101,500 | $312,400 |
| 2021 | $4,659 | $336,900 | $97,000 | $239,900 |
| 2020 | $3,550 | $245,700 | $92,600 | $153,100 |
| 2019 | $3,469 | $237,900 | $96,700 | $141,200 |
| 2018 | $3,091 | $211,400 | $97,500 | $113,900 |
| 2017 | $2,871 | $205,100 | $97,500 | $107,600 |
| 2016 | $2,798 | $205,300 | $100,400 | $104,900 |
| 2015 | $2,721 | $208,000 | $100,400 | $107,600 |
| 2014 | $2,737 | $217,600 | $100,400 | $117,200 |
Source: Public Records
Map
Nearby Homes
Your Personal Tour Guide
Ask me questions while you tour the home.