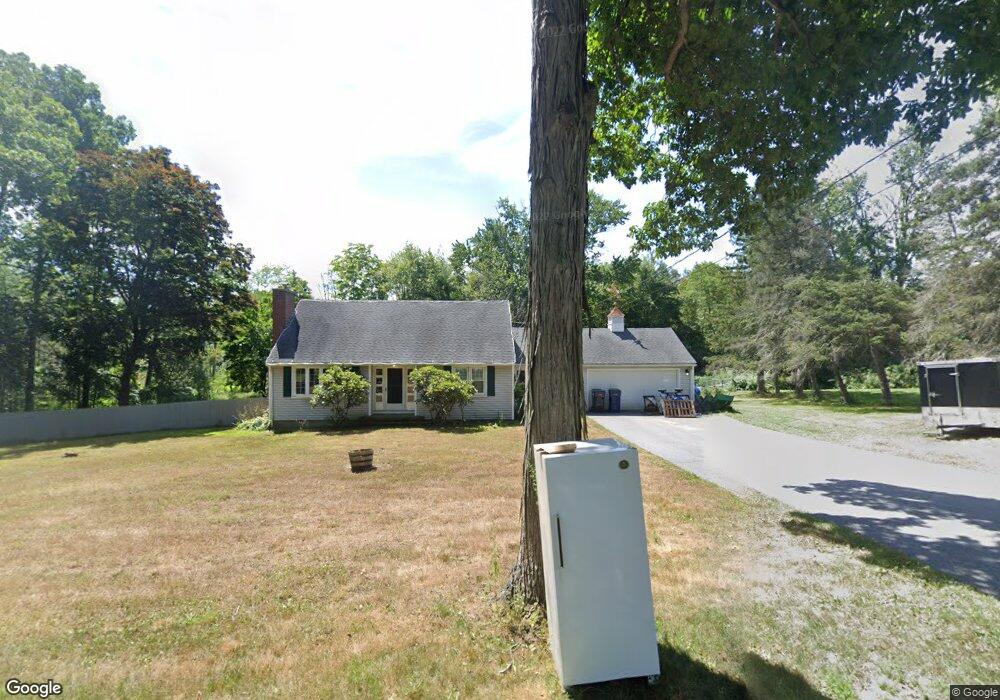
45 Weingart Rd Harwinton, CT 06791
Estimated Value: $377,000 - $459,000
3
Beds
2
Baths
1,840
Sq Ft
$232/Sq Ft
Est. Value
About This Home
This home is located at 45 Weingart Rd, Harwinton, CT 06791 and is currently estimated at $427,302, approximately $232 per square foot. 45 Weingart Rd is a home located in Litchfield County with nearby schools including Harwinton Consolidated School, Har-Bur Middle School, and Lewis S. Mills High School.
Ownership History
Date
Name
Owned For
Owner Type
Purchase Details
Closed on
Jun 30, 2022
Sold by
Abbott Jason N
Bought by
Abbott Jason N and Abbott Skylar A
Current Estimated Value
Home Financials for this Owner
Home Financials are based on the most recent Mortgage that was taken out on this home.
Original Mortgage
$177,000
Outstanding Balance
$169,137
Interest Rate
5.78%
Mortgage Type
Stand Alone Refi Refinance Of Original Loan
Estimated Equity
$258,165
Purchase Details
Closed on
Jul 19, 2018
Sold by
Thrall Nancy J and Thrall Peter J
Bought by
Abbott Jason N
Purchase Details
Closed on
Nov 29, 2012
Sold by
Thrall John H
Bought by
Thrall Nancy J and Thrall Peter J
Create a Home Valuation Report for This Property
The Home Valuation Report is an in-depth analysis detailing your home's value as well as a comparison with similar homes in the area
Home Values in the Area
Average Home Value in this Area
Purchase History
| Date | Buyer | Sale Price | Title Company |
|---|---|---|---|
| Abbott Jason N | -- | None Available | |
| Abbott Jason N | -- | None Available | |
| Abbott Jason N | -- | None Available | |
| Abbott Jason N | $142,000 | -- | |
| Thrall Peter J | $142,000 | -- | |
| Thrall Nancy J | -- | -- | |
| Abbott Jason N | $142,000 | -- | |
| Thrall Nancy J | -- | -- |
Source: Public Records
Mortgage History
| Date | Status | Borrower | Loan Amount |
|---|---|---|---|
| Open | Abbott Jason N | $177,000 | |
| Closed | Abbott Jason N | $177,000 |
Source: Public Records
Tax History Compared to Growth
Tax History
| Year | Tax Paid | Tax Assessment Tax Assessment Total Assessment is a certain percentage of the fair market value that is determined by local assessors to be the total taxable value of land and additions on the property. | Land | Improvement |
|---|---|---|---|---|
| 2025 | $6,018 | $261,660 | $70,870 | $190,790 |
| 2024 | $5,992 | $261,660 | $70,870 | $190,790 |
| 2023 | $4,168 | $142,750 | $50,620 | $92,130 |
| 2022 | $4,068 | $142,750 | $50,620 | $92,130 |
| 2021 | $4,097 | $142,750 | $50,620 | $92,130 |
| 2020 | $3,997 | $142,750 | $50,620 | $92,130 |
| 2019 | $3,997 | $142,750 | $50,620 | $92,130 |
| 2018 | $4,395 | $156,970 | $64,920 | $92,050 |
| 2017 | $4,364 | $156,970 | $64,920 | $92,050 |
| 2016 | $4,364 | $156,970 | $64,920 | $92,050 |
| 2015 | $4,285 | $156,970 | $64,920 | $92,050 |
| 2014 | $4,222 | $156,970 | $64,920 | $92,050 |
Source: Public Records
Map
Nearby Homes
- 74 Pine Ridge Dr
- 69 Sunrise Dr
- 144 Morningside Dr
- 29 Hannah Way
- 73 Shirley Rd
- 33 Dawn Ave
- 51 Bradford Rd
- 29 Branch Rd
- 141 Highfield Dr
- 119 Tognalli Dr
- 178 Edgewood Dr
- 528 Clearview Ave
- 157 Edgewood Dr
- 410 Circle Dr
- 165 Birchwood Dr
- 71 Tognalli Dr
- 164 Birge Park Rd
- 111 Oxbow Dr
- 325 Circle Dr
- 63 Barbero Dr
- 10 Weingart Rd
- 59 Weingart Rd
- 25 Weingart Rd
- 15 Weingart Rd
- 19 Weingart Rd
- 11 Weingart Rd
- 57 Lake Harwinton Rd
- 77 Weingart Rd
- 85 Weingart Rd
- 7 Weingart Rd
- 78 Weingart Rd
- 53 Lake Harwinton Rd
- 71 Lake Harwinton Rd
- 5 Weingart Rd
- 61 Lake Harwinton Rd
- 4 Weingart Rd
- 77 Lake Harwinton Rd
- 75 Lake Harwinton Rd
- 65 Lake Harwinton Rd
- 90 Weingart Rd