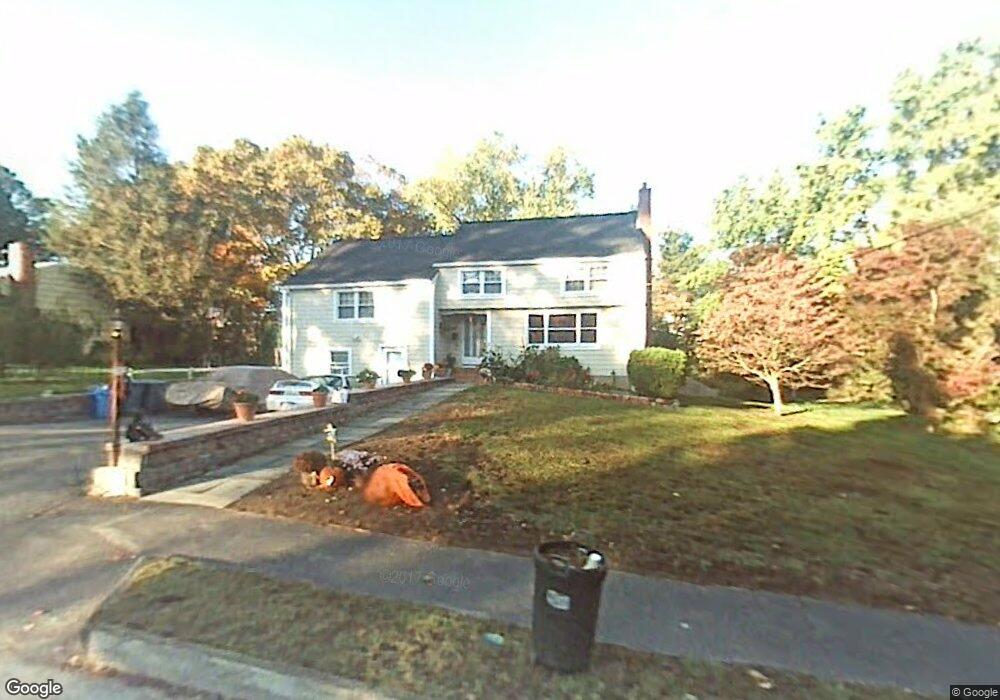
45 Weir Rd Waltham, MA 02451
Piety Corner NeighborhoodEstimated Value: $929,990 - $1,022,000
5
Beds
2
Baths
2,406
Sq Ft
$405/Sq Ft
Est. Value
About This Home
This home is located at 45 Weir Rd, Waltham, MA 02451 and is currently estimated at $975,498, approximately $405 per square foot. 45 Weir Rd is a home located in Middlesex County with nearby schools including Douglas Macarthur Elementary School, John F Kennedy Middle School, and Waltham Sr High School.
Ownership History
Date
Name
Owned For
Owner Type
Purchase Details
Closed on
May 30, 2002
Sold by
Potter Dean R and Potter Susan M
Bought by
Tutiven Melvin W
Current Estimated Value
Home Financials for this Owner
Home Financials are based on the most recent Mortgage that was taken out on this home.
Original Mortgage
$400,000
Outstanding Balance
$171,398
Interest Rate
7%
Mortgage Type
Purchase Money Mortgage
Estimated Equity
$804,100
Purchase Details
Closed on
Mar 28, 1995
Sold by
Farrell Robert D and Farrell Sandar J
Bought by
Potter Dean R
Home Financials for this Owner
Home Financials are based on the most recent Mortgage that was taken out on this home.
Original Mortgage
$114,000
Interest Rate
8.78%
Mortgage Type
Purchase Money Mortgage
Create a Home Valuation Report for This Property
The Home Valuation Report is an in-depth analysis detailing your home's value as well as a comparison with similar homes in the area
Home Values in the Area
Average Home Value in this Area
Purchase History
| Date | Buyer | Sale Price | Title Company |
|---|---|---|---|
| Tutiven Melvin W | $452,500 | -- | |
| Potter Dean R | $176,000 | -- |
Source: Public Records
Mortgage History
| Date | Status | Borrower | Loan Amount |
|---|---|---|---|
| Open | Tutiven Melvin W | $400,000 | |
| Previous Owner | Potter Dean R | $112,000 | |
| Previous Owner | Potter Dean R | $114,000 | |
| Previous Owner | Potter Dean R | $208,100 |
Source: Public Records
Tax History
| Year | Tax Paid | Tax Assessment Tax Assessment Total Assessment is a certain percentage of the fair market value that is determined by local assessors to be the total taxable value of land and additions on the property. | Land | Improvement |
|---|---|---|---|---|
| 2025 | $7,643 | $778,300 | $434,700 | $343,600 |
| 2024 | $7,265 | $753,600 | $414,000 | $339,600 |
| 2023 | $7,257 | $703,200 | $378,000 | $325,200 |
| 2022 | $7,165 | $643,200 | $342,000 | $301,200 |
| 2021 | $0 | $628,000 | $342,000 | $286,000 |
| 2020 | $6,389 | $582,400 | $324,000 | $258,400 |
| 2019 | $7,136 | $563,700 | $305,300 | $258,400 |
| 2018 | $244,582 | $515,300 | $282,600 | $232,700 |
| 2017 | $6,144 | $489,200 | $256,500 | $232,700 |
| 2016 | $5,779 | $472,100 | $239,400 | $232,700 |
| 2015 | $5,679 | $432,500 | $225,000 | $207,500 |
Source: Public Records
Map
Nearby Homes
- 11 Autumn Ln
- 15 Cedarcroft Ln
- 31 Walton St
- 28 Hillcrest St
- 98 Seminole Ave
- 23 Hillcrest St
- 249 Lake St
- 234 Lake St
- 63 Montclair Ave
- 179 Lake St
- 16 Winter St Unit 26C
- 133 Lake St
- 14 Piedmont Ave
- 12 Curve St
- 89 Hardy Pond Rd
- 1393 Trapelo Rd
- 49 Lincoln St
- 50 Worcester Ln
- 14 Willard St
- 501 Lexington St Unit 11
Your Personal Tour Guide
Ask me questions while you tour the home.