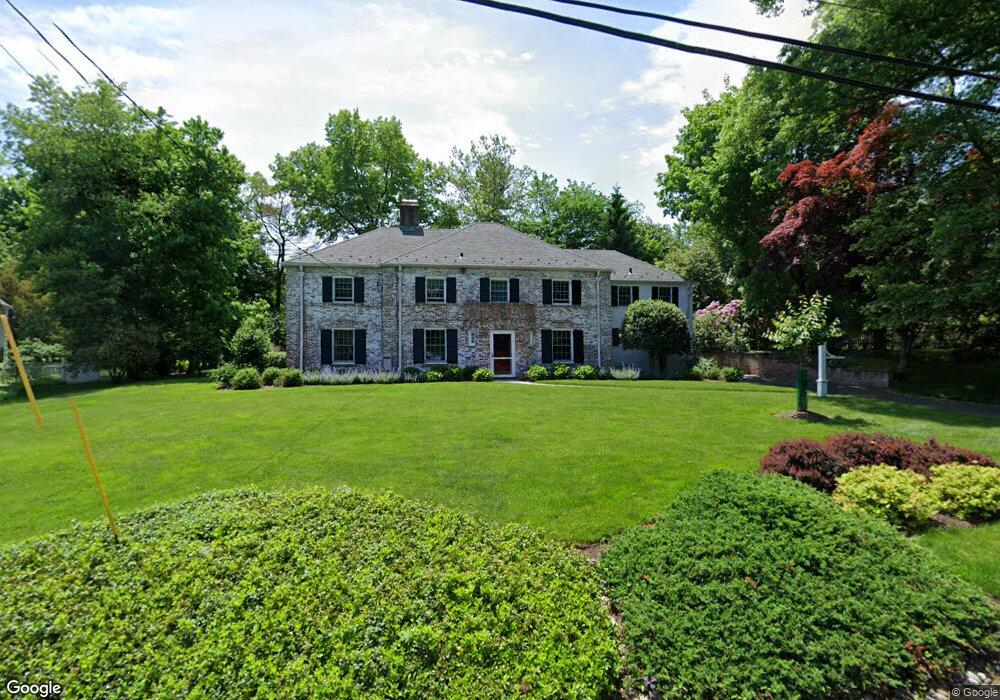
45 West Rd Short Hills, NJ 07078
Estimated Value: $1,979,000 - $2,344,000
--
Bed
--
Bath
3,835
Sq Ft
$576/Sq Ft
Est. Value
About This Home
This home is located at 45 West Rd, Short Hills, NJ 07078 and is currently estimated at $2,210,359, approximately $576 per square foot. 45 West Rd is a home located in Essex County with nearby schools including Glenwood Elementary School, Millburn Middle School, and Millburn High School.
Ownership History
Date
Name
Owned For
Owner Type
Purchase Details
Closed on
Dec 13, 2010
Sold by
Hulten Robert A and Hulten Hillary G
Bought by
Schwartz Evan and Schwartz Christine
Current Estimated Value
Home Financials for this Owner
Home Financials are based on the most recent Mortgage that was taken out on this home.
Original Mortgage
$729,000
Outstanding Balance
$481,881
Interest Rate
4.23%
Mortgage Type
New Conventional
Estimated Equity
$1,728,478
Create a Home Valuation Report for This Property
The Home Valuation Report is an in-depth analysis detailing your home's value as well as a comparison with similar homes in the area
Home Values in the Area
Average Home Value in this Area
Purchase History
| Date | Buyer | Sale Price | Title Company |
|---|---|---|---|
| Schwartz Evan | $1,207,500 | Chicago Title Insurance Co |
Source: Public Records
Mortgage History
| Date | Status | Borrower | Loan Amount |
|---|---|---|---|
| Open | Schwartz Evan | $729,000 |
Source: Public Records
Tax History Compared to Growth
Tax History
| Year | Tax Paid | Tax Assessment Tax Assessment Total Assessment is a certain percentage of the fair market value that is determined by local assessors to be the total taxable value of land and additions on the property. | Land | Improvement |
|---|---|---|---|---|
| 2025 | $26,541 | $1,356,900 | $640,000 | $716,900 |
| 2024 | $26,541 | $1,356,900 | $640,000 | $716,900 |
| 2022 | $26,365 | $1,356,900 | $640,000 | $716,900 |
| 2021 | $26,297 | $1,356,900 | $640,000 | $716,900 |
| 2020 | $26,134 | $1,356,900 | $640,000 | $716,900 |
| 2019 | $26,188 | $1,356,900 | $640,000 | $716,900 |
| 2018 | $25,808 | $1,356,900 | $640,000 | $716,900 |
| 2017 | $25,184 | $1,356,900 | $640,000 | $716,900 |
| 2016 | $24,622 | $1,143,100 | $591,300 | $551,800 |
| 2015 | $24,062 | $1,124,400 | $591,300 | $533,100 |
| 2014 | $22,668 | $1,124,400 | $591,300 | $533,100 |
Source: Public Records
Map
Nearby Homes
- 59 West Rd
- 16 West Rd
- 12 Coniston Rd
- 39 Huntley Rd
- 58 Prospect Hill Ave
- 285 Taylor Rd S
- 55 Oxbow Ln
- 6 Cambridge Dr
- 60 Fernwood Rd
- 368 Hartshorn Dr
- 149 Hillcrest Ave
- 61 Taylor Rd
- 181 Summit Ave
- 41A Middle Ave
- 160 Springfield Ave
- 30 Wildwood Ln
- 10 Waldron Ave
- 19 Shelley Rd
- 133 Summit Ave Unit 10
- 330 Hartshorn Dr
- 49 West Rd
- 41 West Rd
- 55 West Rd
- 44 West Rd
- 2 Windermere Terrace
- 33 West Rd
- 38 West Rd
- 25 Lakeview Ave
- 10 Windermere Terrace
- 33 Lakeview Ave
- 24 Sheffield Rd
- 20 Sheffield Rd
- 3 Windermere Terrace
- 63 West Rd
- 16 Windermere Terrace
- 30 Sheffield Rd
- 34 Sheffield Rd
- 16 Sheffield Rd
- 25 West Rd
- 40 Sheffield Rd