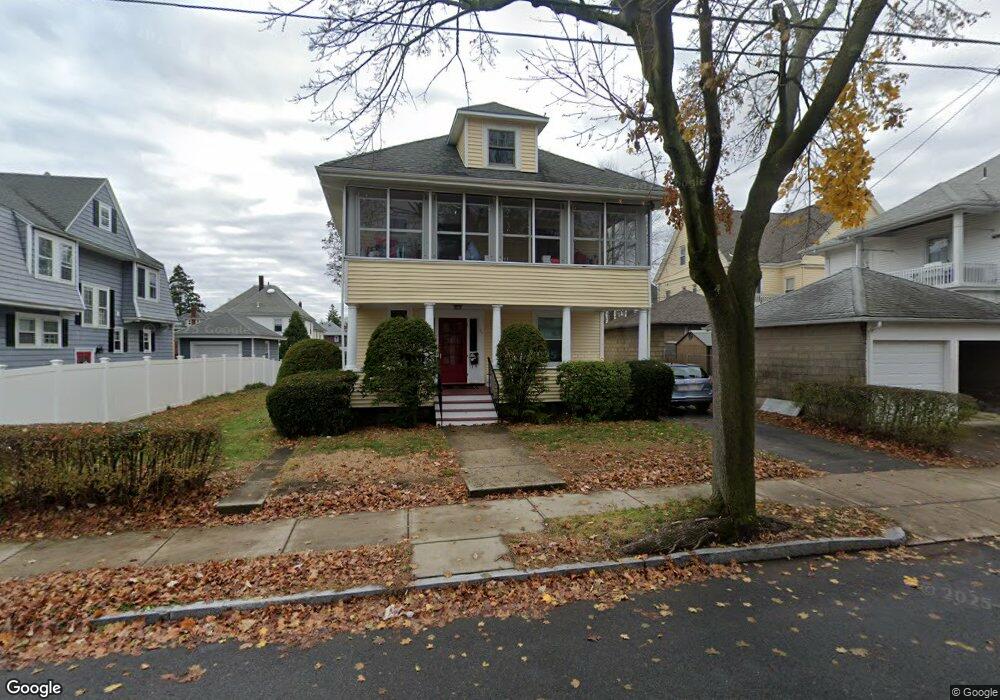
45 Willow St Unit 45 Quincy, MA 02170
Wollaston NeighborhoodEstimated Value: $1,028,076 - $1,139,000
3
Beds
1
Bath
1,400
Sq Ft
$759/Sq Ft
Est. Value
About This Home
This home is located at 45 Willow St Unit 45, Quincy, MA 02170 and is currently estimated at $1,062,269, approximately $758 per square foot. 45 Willow St Unit 45 is a home located in Norfolk County with nearby schools including Beechwood Knoll Elementary School, Central Middle School, and North Quincy High School.
Ownership History
Date
Name
Owned For
Owner Type
Purchase Details
Closed on
Oct 20, 2014
Sold by
Wel Green T
Bought by
Zheng Yan and Zheng Xue X
Current Estimated Value
Home Financials for this Owner
Home Financials are based on the most recent Mortgage that was taken out on this home.
Original Mortgage
$212,000
Outstanding Balance
$187,741
Interest Rate
5%
Mortgage Type
New Conventional
Estimated Equity
$874,528
Purchase Details
Closed on
May 22, 2009
Sold by
Weinberg Aaron L
Bought by
Weinberg Aron S and Green Lynn
Create a Home Valuation Report for This Property
The Home Valuation Report is an in-depth analysis detailing your home's value as well as a comparison with similar homes in the area
Home Values in the Area
Average Home Value in this Area
Purchase History
| Date | Buyer | Sale Price | Title Company |
|---|---|---|---|
| Zheng Yan | $602,000 | -- | |
| Weinberg Aron S | -- | -- |
Source: Public Records
Mortgage History
| Date | Status | Borrower | Loan Amount |
|---|---|---|---|
| Open | Zheng Yan | $212,000 |
Source: Public Records
Tax History Compared to Growth
Tax History
| Year | Tax Paid | Tax Assessment Tax Assessment Total Assessment is a certain percentage of the fair market value that is determined by local assessors to be the total taxable value of land and additions on the property. | Land | Improvement |
|---|---|---|---|---|
| 2025 | $10,808 | $937,400 | $358,100 | $579,300 |
| 2024 | $10,371 | $920,200 | $358,100 | $562,100 |
| 2023 | $9,859 | $885,800 | $341,000 | $544,800 |
| 2022 | $9,501 | $793,100 | $272,900 | $520,200 |
| 2021 | $9,672 | $796,700 | $272,900 | $523,800 |
| 2020 | $9,597 | $772,100 | $272,900 | $499,200 |
| 2019 | $9,047 | $720,900 | $255,000 | $465,900 |
| 2018 | $8,427 | $631,700 | $231,800 | $399,900 |
| 2017 | $8,340 | $588,600 | $231,800 | $356,800 |
| 2016 | $7,413 | $516,200 | $210,700 | $305,500 |
| 2015 | $7,011 | $480,200 | $191,600 | $288,600 |
| 2014 | $6,072 | $408,600 | $182,400 | $226,200 |
Source: Public Records
Map
Nearby Homes
- 101 Beach St
- 140 Phillips St
- 11 Earle St
- 522 Hancock St
- 163 Clay St Unit C
- 100 Thornton St
- 250 Fayette St
- 22 Newton Ave
- 143 Arlington St
- 100 Grandview Ave Unit 11A
- 111 Warren Ave Unit 1F
- 6 Warwick St
- 465 Newport Ave
- 45 Marion St
- 165 Old Colony Ave Unit A
- 45 Oval Rd Unit 6
- 17 Holmes St Unit 2
- 17 Holmes St Unit 4
- 20 Putnam St
- 72 Oakland Ave