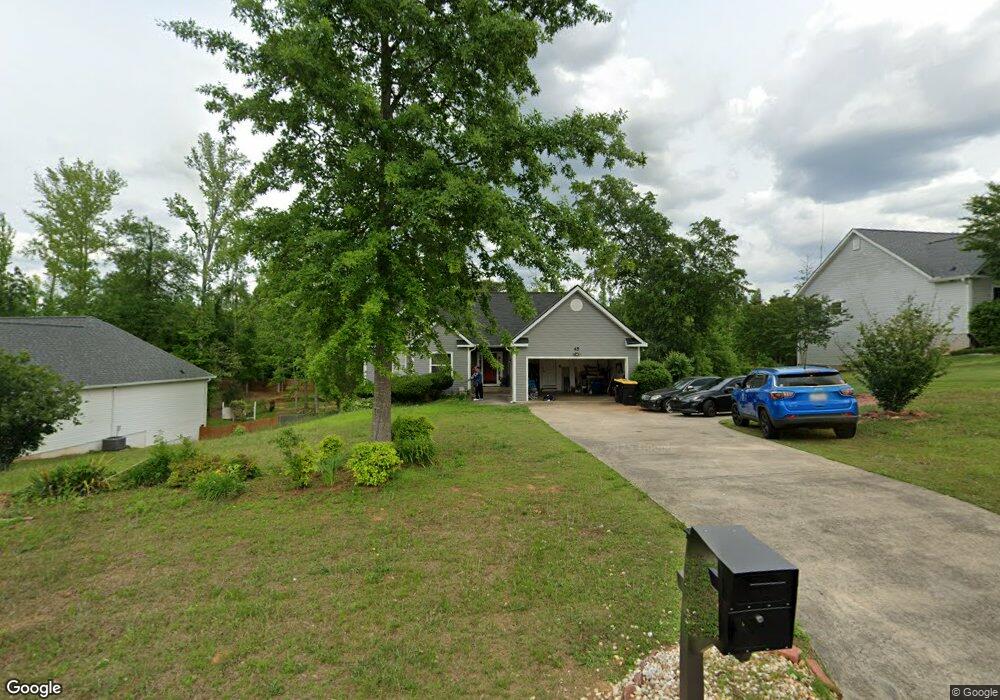
45 Woodrow Place Newnan, GA 30263
Estimated Value: $273,587 - $354,000
4
Beds
3
Baths
2,734
Sq Ft
$116/Sq Ft
Est. Value
About This Home
This home is located at 45 Woodrow Place, Newnan, GA 30263 and is currently estimated at $316,147, approximately $115 per square foot. 45 Woodrow Place is a home located in Coweta County with nearby schools including Ruth Hill Elementary School, Smokey Road Middle School, and Newnan High School.
Ownership History
Date
Name
Owned For
Owner Type
Purchase Details
Closed on
Jun 6, 2007
Sold by
Mcwhorter Kimberly M and Mcwhorter Godfrey
Bought by
Moore Troquita R
Current Estimated Value
Home Financials for this Owner
Home Financials are based on the most recent Mortgage that was taken out on this home.
Original Mortgage
$160,900
Outstanding Balance
$97,603
Interest Rate
6.12%
Mortgage Type
VA
Estimated Equity
$218,544
Purchase Details
Closed on
Aug 3, 2001
Sold by
Edwards Builders Inc
Bought by
Mcwhorter Godfrey and Mcwhorter Kimberly M
Home Financials for this Owner
Home Financials are based on the most recent Mortgage that was taken out on this home.
Original Mortgage
$137,935
Interest Rate
7.1%
Mortgage Type
FHA
Purchase Details
Closed on
Dec 6, 1999
Sold by
C & W Development In
Bought by
Sam Edwards Builders
Purchase Details
Closed on
Aug 31, 1998
Bought by
C & W Development In
Create a Home Valuation Report for This Property
The Home Valuation Report is an in-depth analysis detailing your home's value as well as a comparison with similar homes in the area
Home Values in the Area
Average Home Value in this Area
Purchase History
| Date | Buyer | Sale Price | Title Company |
|---|---|---|---|
| Moore Troquita R | $160,900 | -- | |
| Mcwhorter Godfrey | $140,100 | -- | |
| Sam Edwards Builders | $108,000 | -- | |
| C & W Development In | $166,700 | -- |
Source: Public Records
Mortgage History
| Date | Status | Borrower | Loan Amount |
|---|---|---|---|
| Open | Moore Troquita R | $160,900 | |
| Previous Owner | Mcwhorter Godfrey | $137,935 |
Source: Public Records
Tax History Compared to Growth
Tax History
| Year | Tax Paid | Tax Assessment Tax Assessment Total Assessment is a certain percentage of the fair market value that is determined by local assessors to be the total taxable value of land and additions on the property. | Land | Improvement |
|---|---|---|---|---|
| 2025 | $118 | $126,709 | $24,000 | $102,709 |
| 2024 | $266 | $128,656 | $24,000 | $104,656 |
| 2023 | $266 | $135,715 | $16,000 | $119,715 |
| 2022 | $0 | $99,772 | $16,000 | $83,772 |
| 2021 | $24 | $87,372 | $12,000 | $75,372 |
| 2020 | $24 | $87,372 | $12,000 | $75,372 |
| 2019 | $24 | $86,456 | $10,000 | $76,456 |
| 2018 | $2,613 | $86,456 | $10,000 | $76,456 |
| 2017 | $1,894 | $62,931 | $10,000 | $52,931 |
| 2016 | $1,279 | $42,464 | $6,000 | $36,464 |
| 2015 | $1,281 | $42,464 | $6,000 | $36,464 |
| 2014 | $1,310 | $42,464 | $6,000 | $36,464 |
Source: Public Records
Map
Nearby Homes
- 261 Lagrange St
- 218 Arlington Ct
- 89 Bailey Dr
- 25 Bailey Dr
- 0 Smokey Rd Unit 10495165
- 18 Rutherford Dr Unit LOT 28
- 114 Boone Dr
- 0 Belk Rd Unit 10545375
- 623 Belk Rd
- 157 Lagrange St
- 70 Hollis Heights
- 131 Woodbine Cir
- 37 Westgate Park Ln
- 100 Lovelace St
- 26 Boone Dr
- 25 Westgate Park Dr
- 17 Westgate Park Dr
- 66 Westside School Rd
- 97 W Washington St
- 16 Hamilton Bohannon Dr
- 55 Woodrow Place
- 37 Woodrow Place
- 63 Woodrow Place
- 29 Woodrow Place
- 48 Woodrow Place
- 40 Woodrow Place
- 56 Woodrow Place
- 71 Woodrow Place
- 32 Woodrow Place
- 64 Woodrow Place
- 21 Woodrow Place
- 24 Woodrow Place
- 72 Woodrow Place
- 245 Lagrange
- 83 Woodrow Place
- 241 Lagrange St
- 253 Lagrange St
- 173 Arlington Ct
- 249 Lagrange St
- 257 Lagrange St