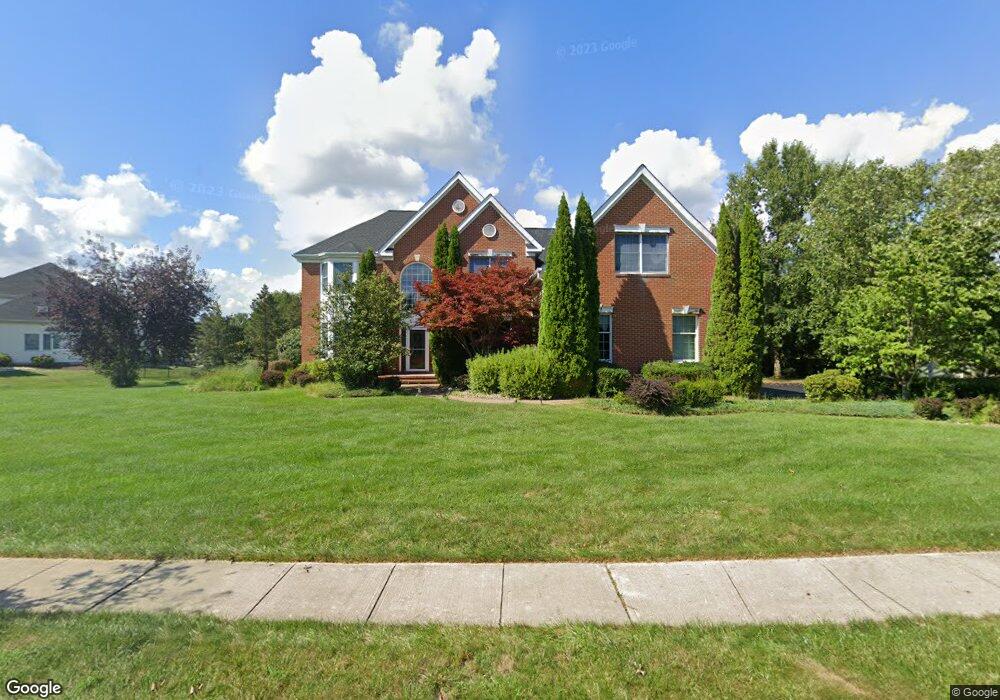
45 Zaitz Farm Rd Princeton Junction, NJ 08550
Estimated Value: $1,416,764 - $1,651,000
4
Beds
3
Baths
3,664
Sq Ft
$418/Sq Ft
Est. Value
About This Home
This home is located at 45 Zaitz Farm Rd, Princeton Junction, NJ 08550 and is currently estimated at $1,532,691, approximately $418 per square foot. 45 Zaitz Farm Rd is a home located in Mercer County with nearby schools including Village Elementary School, Dutch Neck Elementary School, and Thomas R. Grover Middle School.
Ownership History
Date
Name
Owned For
Owner Type
Purchase Details
Closed on
Aug 31, 2009
Sold by
Ye Zhixiong and Xu Qinghong
Bought by
Chovatia Janak and Chovatia Manjari
Current Estimated Value
Home Financials for this Owner
Home Financials are based on the most recent Mortgage that was taken out on this home.
Original Mortgage
$417,000
Outstanding Balance
$275,062
Interest Rate
5.36%
Mortgage Type
New Conventional
Estimated Equity
$1,257,629
Purchase Details
Closed on
Jul 26, 2004
Sold by
Krishnamoorthy Ramaiyah
Bought by
Zhixiong Ye and Qinghang Xu
Home Financials for this Owner
Home Financials are based on the most recent Mortgage that was taken out on this home.
Original Mortgage
$615,000
Interest Rate
6.33%
Purchase Details
Closed on
Mar 19, 1999
Sold by
Brookline Estates Lp
Bought by
Krishnamoorthy Ramaiyah and Krishnamoorthy Kanchana
Home Financials for this Owner
Home Financials are based on the most recent Mortgage that was taken out on this home.
Original Mortgage
$335,150
Interest Rate
7.02%
Create a Home Valuation Report for This Property
The Home Valuation Report is an in-depth analysis detailing your home's value as well as a comparison with similar homes in the area
Home Values in the Area
Average Home Value in this Area
Purchase History
| Date | Buyer | Sale Price | Title Company |
|---|---|---|---|
| Chovatia Janak | $832,000 | First American Title Ins Co | |
| Zhixiong Ye | $770,000 | -- | |
| Krishnamoorthy Ramaiyah | $412,542 | -- |
Source: Public Records
Mortgage History
| Date | Status | Borrower | Loan Amount |
|---|---|---|---|
| Open | Chovatia Janak | $417,000 | |
| Previous Owner | Zhixiong Ye | $615,000 | |
| Previous Owner | Krishnamoorthy Ramaiyah | $335,150 |
Source: Public Records
Tax History Compared to Growth
Tax History
| Year | Tax Paid | Tax Assessment Tax Assessment Total Assessment is a certain percentage of the fair market value that is determined by local assessors to be the total taxable value of land and additions on the property. | Land | Improvement |
|---|---|---|---|---|
| 2025 | $25,446 | $830,200 | $316,100 | $514,100 |
| 2024 | $24,383 | $830,200 | $316,100 | $514,100 |
| 2023 | $24,383 | $830,200 | $316,100 | $514,100 |
| 2022 | $23,910 | $830,200 | $316,100 | $514,100 |
| 2021 | $23,711 | $830,200 | $316,100 | $514,100 |
| 2020 | $23,279 | $830,200 | $316,100 | $514,100 |
| 2019 | $23,013 | $830,200 | $316,100 | $514,100 |
| 2018 | $22,797 | $830,200 | $316,100 | $514,100 |
| 2017 | $22,324 | $830,200 | $316,100 | $514,100 |
| 2016 | $21,843 | $830,200 | $316,100 | $514,100 |
| 2015 | $21,336 | $830,200 | $316,100 | $514,100 |
| 2014 | $21,087 | $830,200 | $316,100 | $514,100 |
Source: Public Records
Map
Nearby Homes
- 75 Honeyflower Ln
- 17 Grande Blvd
- 6 Grande Blvd
- 26 Rainflower La
- 84 Rainflower La
- 302 Blanketflower Ln
- 55 Rainflower Ln
- 42 Holtz Way
- 36 Holtz Way
- 19 Holtz Way
- 31 Cooper Ct
- 13 Holtz Way
- 13 Cooper Ct
- 10 Cherry Ln
- 8 Cherry Ln
- 6 Cherry Ln
- 11 Cooper Ct
- 6 Meade Dr
- 1 Cooper Ct
- Rosehayn Elite Plan at Regency at West Windsor
- 43 Zaitz Farm Rd
- 47 Zaitz Farm Rd
- 50 Zaitz Farm Rd
- 48 Zaitz Farm Rd
- 41 Zaitz Farm Rd
- 46 Zaitz Farm Rd
- 49 Zaitz Farm Rd
- 44 Zaitz Farm Rd
- 52 Zaitz Farm Rd
- 42 Zaitz Farm Rd
- 3 Pennington Dr
- 39 Zaitz Farm Rd
- 7 Benjamin Ct
- 37 Zaitz Farm Rd
- 5 Benjamin Ct
- 51 Zaitz Farm Rd
- 4 Pennington Dr
- 3 Benjamin Ct
- 35 Zaitz Farm Rd
- 4 Schenck Rd