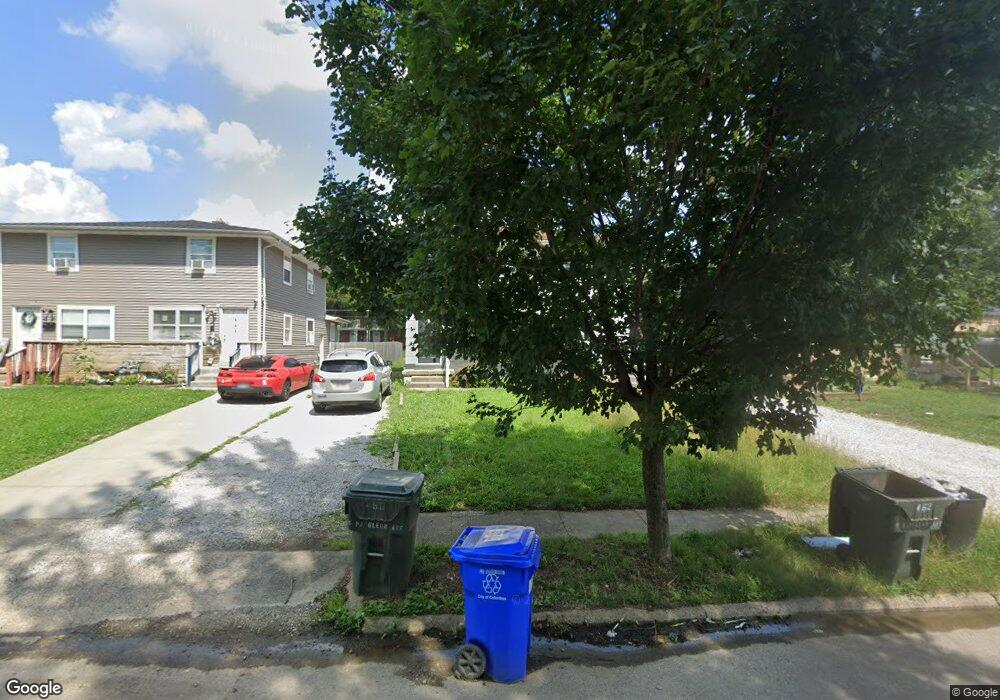
450-452 S Napoleon Ave Columbus, OH 43213
Eastmoor NeighborhoodEstimated Value: $239,010 - $264,000
6
Beds
2
Baths
2,280
Sq Ft
$111/Sq Ft
Est. Value
About This Home
This home is located at 450-452 S Napoleon Ave, Columbus, OH 43213 and is currently estimated at $254,003, approximately $111 per square foot. 450-452 S Napoleon Ave is a home located in Franklin County with nearby schools including Fairmoor Elementary School, Johnson Park Middle School, and Walnut Ridge High School.
Ownership History
Date
Name
Owned For
Owner Type
Purchase Details
Closed on
Jun 22, 2023
Sold by
Johnson Real Estate Investment Group Ltd
Bought by
Kocho Shirley
Current Estimated Value
Purchase Details
Closed on
Oct 24, 2018
Sold by
Pantheon Properties Llc
Bought by
Johnson Real Estate Investment Group Ltd
Purchase Details
Closed on
Dec 29, 2009
Sold by
Rose Scott and Rose Jo Ann
Bought by
Pantheon Properties Llc
Purchase Details
Closed on
Aug 31, 1999
Sold by
Wright Timothy E and Wright Margaret E
Bought by
Rose Scott and Rose Joann
Home Financials for this Owner
Home Financials are based on the most recent Mortgage that was taken out on this home.
Original Mortgage
$64,000
Interest Rate
7.59%
Mortgage Type
Balloon
Purchase Details
Closed on
Sep 26, 1991
Bought by
Wright Timothy E
Purchase Details
Closed on
Jun 6, 1989
Purchase Details
Closed on
Jul 28, 1988
Create a Home Valuation Report for This Property
The Home Valuation Report is an in-depth analysis detailing your home's value as well as a comparison with similar homes in the area
Home Values in the Area
Average Home Value in this Area
Purchase History
| Date | Buyer | Sale Price | Title Company |
|---|---|---|---|
| Kocho Shirley | $242,500 | Title Connect | |
| Johnson Real Estate Investment Group Ltd | $69,000 | Pm Title Box | |
| Pantheon Properties Llc | $20,000 | Title First | |
| Rose Scott | $80,000 | Peterson Title Agency | |
| Wright Timothy E | $48,000 | -- | |
| -- | -- | -- | |
| -- | -- | -- |
Source: Public Records
Mortgage History
| Date | Status | Borrower | Loan Amount |
|---|---|---|---|
| Previous Owner | Rose Scott | $64,000 |
Source: Public Records
Tax History Compared to Growth
Tax History
| Year | Tax Paid | Tax Assessment Tax Assessment Total Assessment is a certain percentage of the fair market value that is determined by local assessors to be the total taxable value of land and additions on the property. | Land | Improvement |
|---|---|---|---|---|
| 2024 | $3,134 | $68,390 | $12,390 | $56,000 |
| 2023 | $2,672 | $59,050 | $12,390 | $46,660 |
| 2022 | $1,321 | $24,860 | $6,340 | $18,520 |
| 2021 | $1,324 | $24,860 | $6,340 | $18,520 |
| 2020 | $1,325 | $24,860 | $6,340 | $18,520 |
| 2019 | $1,439 | $20,730 | $5,290 | $15,440 |
| 2018 | $1,001 | $20,730 | $5,290 | $15,440 |
| 2017 | $1,037 | $20,730 | $5,290 | $15,440 |
| 2016 | $785 | $11,560 | $4,730 | $6,830 |
| 2015 | $715 | $11,560 | $4,730 | $6,830 |
| 2014 | $1,621 | $26,150 | $4,730 | $21,420 |
| 2013 | $800 | $26,145 | $4,970 | $21,175 |
Source: Public Records
Map
Nearby Homes
- 647 S Napoleon Ave
- 646 S Weyant Ave
- 526 Collingwood Ave
- 201 S Weyant Ave
- 178 S Weyant Ave
- 733 S Napoleon Ave
- 708 S Waverly St
- 430 S James Rd
- 320 Collingwood Ave
- 635 Elizabeth Ave
- 711 S Waverly St
- 3160 Fair Ave
- 277 S James Rd
- 3814 Elbern Ave
- 622 S Ashburton Rd
- 247 S James Rd
- 91 Maplewood Ave
- 239 S Kellner Rd
- 836 S Weyant Ave
- 565 S Kellner Rd
- 450 S Napoleon Ave Unit 452
- 452 S Napoleon Ave
- 458 S Napoleon Ave
- 456 S Napoleon Ave Unit 458
- 442 S Napoleon Ave Unit 444
- 436-438 S Napoleon Ave
- 436 S Napoleon Ave Unit 438
- 455 Barnett Rd
- 470 S Napoleon Ave
- 430-432 S Napoleon Ave
- 430 S Napoleon Ave Unit 432
- 447-449 S Napoleon Ave
- 476 S Napoleon Ave
- 441-447 Barnett Rd
- 441-443 S Napoleon Ave
- 441 Barnett Rd
- 447 S Napoleon Ave Unit 449
- 3511 Plymouth Ave
- 453-455 S Napoleon Ave
- 441 S Napoleon Ave Unit 443