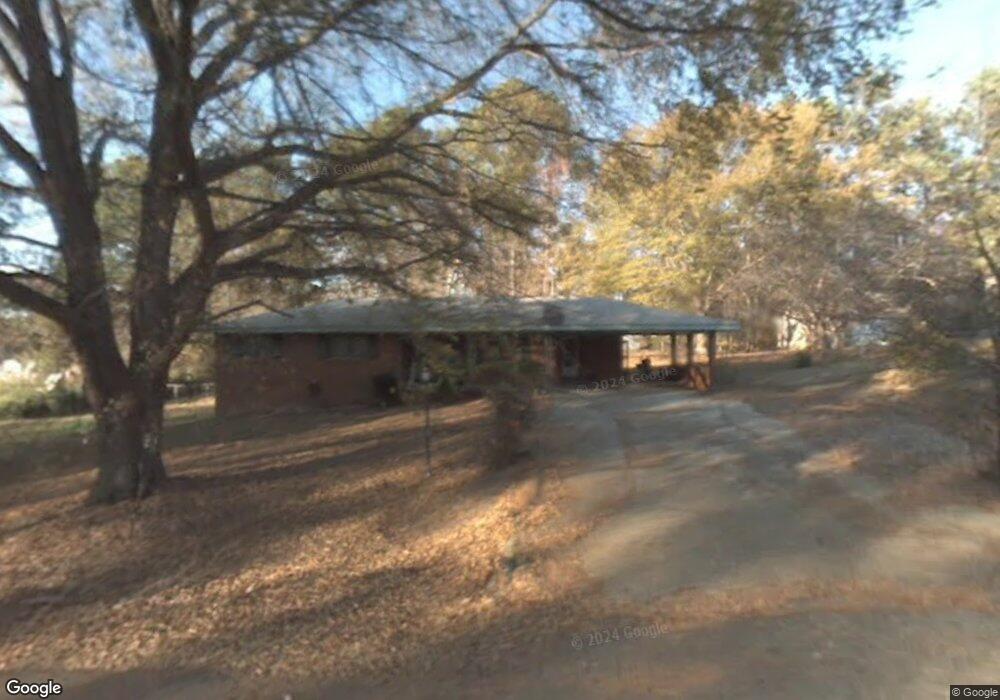
450 Center Cir SW Conyers, GA 30094
Estimated Value: $115,000 - $237,000
3
Beds
2
Baths
1,386
Sq Ft
$119/Sq Ft
Est. Value
About This Home
This home is located at 450 Center Cir SW, Conyers, GA 30094 and is currently estimated at $164,832, approximately $118 per square foot. 450 Center Cir SW is a home located in Rockdale County with nearby schools including Shoal Creek Elementary School, Gen. Ray Davis Middle School, and Heritage High School.
Ownership History
Date
Name
Owned For
Owner Type
Purchase Details
Closed on
Mar 28, 2025
Sold by
Mcclellan Steven P Trust
Bought by
Mrm1 Investments Llc
Current Estimated Value
Home Financials for this Owner
Home Financials are based on the most recent Mortgage that was taken out on this home.
Original Mortgage
$104,850
Outstanding Balance
$104,488
Interest Rate
5.94%
Mortgage Type
New Conventional
Estimated Equity
$60,344
Purchase Details
Closed on
Mar 10, 2022
Sold by
Mcclellan Steven P
Bought by
Steven P Mcclellan Liv Tr
Purchase Details
Closed on
May 8, 2003
Sold by
Bickford Donald R and Bickford Shelly S
Bought by
Mcclellan Steven P and Mcclellan Susan
Home Financials for this Owner
Home Financials are based on the most recent Mortgage that was taken out on this home.
Original Mortgage
$66,800
Interest Rate
5.76%
Mortgage Type
New Conventional
Create a Home Valuation Report for This Property
The Home Valuation Report is an in-depth analysis detailing your home's value as well as a comparison with similar homes in the area
Home Values in the Area
Average Home Value in this Area
Purchase History
| Date | Buyer | Sale Price | Title Company |
|---|---|---|---|
| Mrm1 Investments Llc | $116,500 | -- | |
| Steven P Mcclellan Liv Tr | -- | -- | |
| Mcclellan Steven P | -- | -- | |
| Mcclellan Steven P | $83,500 | -- |
Source: Public Records
Mortgage History
| Date | Status | Borrower | Loan Amount |
|---|---|---|---|
| Open | Mrm1 Investments Llc | $104,850 | |
| Previous Owner | Mcclellan Steven P | $66,800 | |
| Previous Owner | Bickford Donald R | $68,850 |
Source: Public Records
Tax History Compared to Growth
Tax History
| Year | Tax Paid | Tax Assessment Tax Assessment Total Assessment is a certain percentage of the fair market value that is determined by local assessors to be the total taxable value of land and additions on the property. | Land | Improvement |
|---|---|---|---|---|
| 2024 | $2,782 | $68,520 | $17,680 | $50,840 |
| 2023 | $3,160 | $76,320 | $17,400 | $58,920 |
| 2022 | $2,838 | $68,200 | $22,400 | $45,800 |
| 2021 | $2,118 | $50,720 | $11,080 | $39,640 |
| 2020 | $1,867 | $43,400 | $8,000 | $35,400 |
| 2019 | $1,831 | $40,400 | $7,360 | $33,040 |
| 2018 | $1,332 | $29,160 | $4,400 | $24,760 |
| 2017 | $1,217 | $26,360 | $4,800 | $21,560 |
| 2016 | $1,217 | $26,360 | $4,800 | $21,560 |
| 2015 | $1,123 | $24,280 | $3,760 | $20,520 |
| 2014 | $1,200 | $25,680 | $5,160 | $20,520 |
| 2013 | -- | $32,120 | $8,400 | $23,720 |
Source: Public Records
Map
Nearby Homes
- 423 Center Cir SW
- 464 Abbott Rd SW
- 318 Ceder Hollow Dr
- 2833 Abbott Lake Rd SW
- 283 Abbotts Crossing Cir
- 178 Abbotts Crossing Cir
- 200 Abbotts Crossing Cir
- 198 Abbotts Crossing Cir
- 275 Abbotts Crossing Cir
- 198 Abbott Crossing Cir
- 267 Abbotts Crossing Cir
- 180 Abbotts Crossing Cir
- 279 Abbotts Crossing Cir
- 273 Abbotts Crossing Cir
- 273 Abbott Crossing Cir
- 275 Abbott Crossing Cir
- 271 Abbotts Crossing Cir
- 265 Abbotts Crossing Cir
- 456 Center Cir SW
- 446 Center Cir SW
- 414 Center Cir SW
- 418 Center Cir SW
- 447 Center Cir SW
- 459 Center Cir SW
- 460 Center Cir SW
- 25 Center Cir SW Unit D
- 0 Center Cir SW Unit 25 D 7239049
- 25 D Center Cir SW
- 445 Center Cir SW
- 0 Center Cir Unit 8825658
- 2655 S Lakeview Dr SW
- 435 Center Cir SW
- 465 Center Cir SW
- 2667 S Lakeview Dr SW
- 417 Center Cir SW
- 441 Center Cir SW
- 2661 S Lakeview Dr SW Unit 2, 9
- 2643 S Lakeview Dr SW