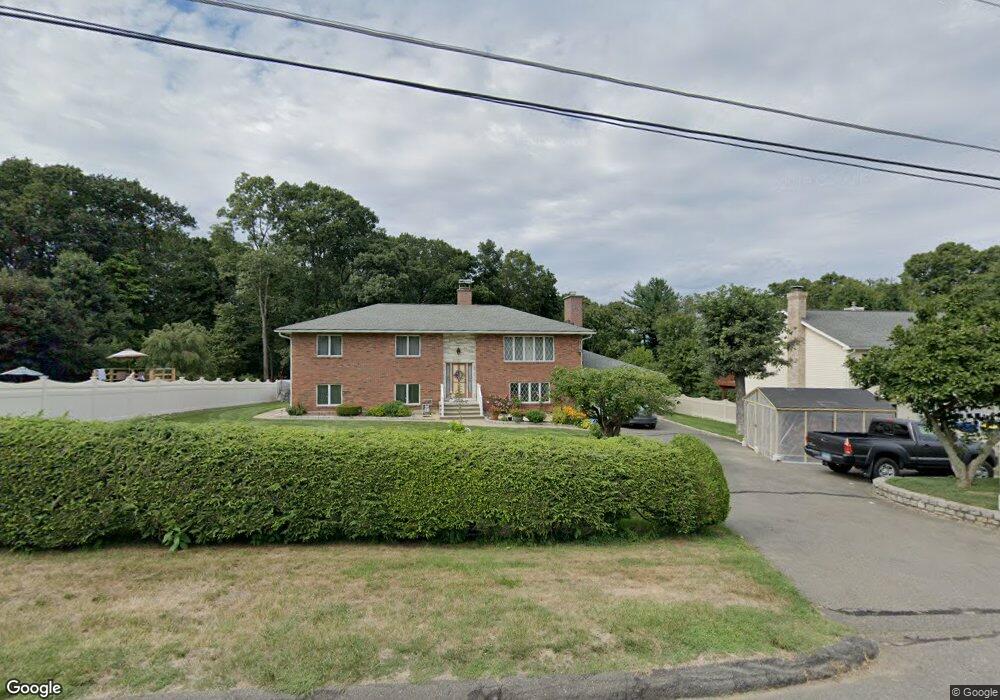
450 Chipman Street Extension Waterbury, CT 06708
West End District NeighborhoodEstimated Value: $336,000 - $439,000
3
Beds
3
Baths
1,512
Sq Ft
$261/Sq Ft
Est. Value
About This Home
This home is located at 450 Chipman Street Extension, Waterbury, CT 06708 and is currently estimated at $394,571, approximately $260 per square foot. 450 Chipman Street Extension is a home located in New Haven County with nearby schools including B.W. Tinker School, West Side Middle School, and John F. Kennedy High School.
Ownership History
Date
Name
Owned For
Owner Type
Purchase Details
Closed on
Feb 3, 2017
Sold by
Perugini Margherita
Bought by
Perugini Anthony M
Current Estimated Value
Create a Home Valuation Report for This Property
The Home Valuation Report is an in-depth analysis detailing your home's value as well as a comparison with similar homes in the area
Home Values in the Area
Average Home Value in this Area
Purchase History
| Date | Buyer | Sale Price | Title Company |
|---|---|---|---|
| Perugini Anthony M | -- | -- |
Source: Public Records
Tax History Compared to Growth
Tax History
| Year | Tax Paid | Tax Assessment Tax Assessment Total Assessment is a certain percentage of the fair market value that is determined by local assessors to be the total taxable value of land and additions on the property. | Land | Improvement |
|---|---|---|---|---|
| 2025 | $10,173 | $226,170 | $44,380 | $181,790 |
| 2024 | $11,182 | $226,170 | $44,380 | $181,790 |
| 2023 | $12,256 | $226,170 | $44,380 | $181,790 |
| 2022 | $8,297 | $137,800 | $44,370 | $93,430 |
| 2021 | $8,297 | $137,800 | $44,370 | $93,430 |
| 2020 | $8,297 | $137,800 | $44,370 | $93,430 |
| 2019 | $8,297 | $137,800 | $44,370 | $93,430 |
| 2018 | $8,297 | $137,800 | $44,370 | $93,430 |
| 2017 | $8,579 | $142,480 | $44,370 | $98,110 |
| 2016 | $8,579 | $142,480 | $44,370 | $98,110 |
| 2015 | $8,295 | $142,480 | $44,370 | $98,110 |
| 2014 | $8,295 | $142,480 | $44,370 | $98,110 |
Source: Public Records
Map
Nearby Homes
- 26 Oakleaf Dr
- 804 Washington Avenue Extension
- 69 Tree Hill Rd
- 49 Southridge Dr
- 29 Tree Hill Rd
- 62 Rosemount Ave
- 87 Highland Dr
- 15 Tree Hill Rd
- 77 Eastfield Rd
- 165 Birchwood St
- 576 Highland Ave
- 55 Eastfield Rd
- 127 Fairfield Ave
- 70 Lawlor St
- 70 Vail St
- 145 Seymour St
- 59 Addison St
- 35 Hewey St
- 1 Ruth Parsons Dr
- 36 Norman St
- 421 Chipman Street Extension
- 466 Chipman Street Extension
- 445 Chipman Street Extension
- 440 Chipman Street Extension
- 461 Chipman Street Extension
- 445 Chipman St
- 443 Chipman Street Extension
- 443 Chipman St
- 428 Chipman Street Extension
- 476 Chipman Street Extension
- 471 Chipman Street Extension
- 425 Chipman St
- 425 Chipman Extension Unit 1st floor
- 484 Chipman Street Extension
- 484 Chipman Street Extension Unit EXT
- 487 Chipman Street Extension
- 414 Chipman Street Extension
- 414 Chipman St
- 411 Chipman Street Extension
- 427 Chipman Street Extension