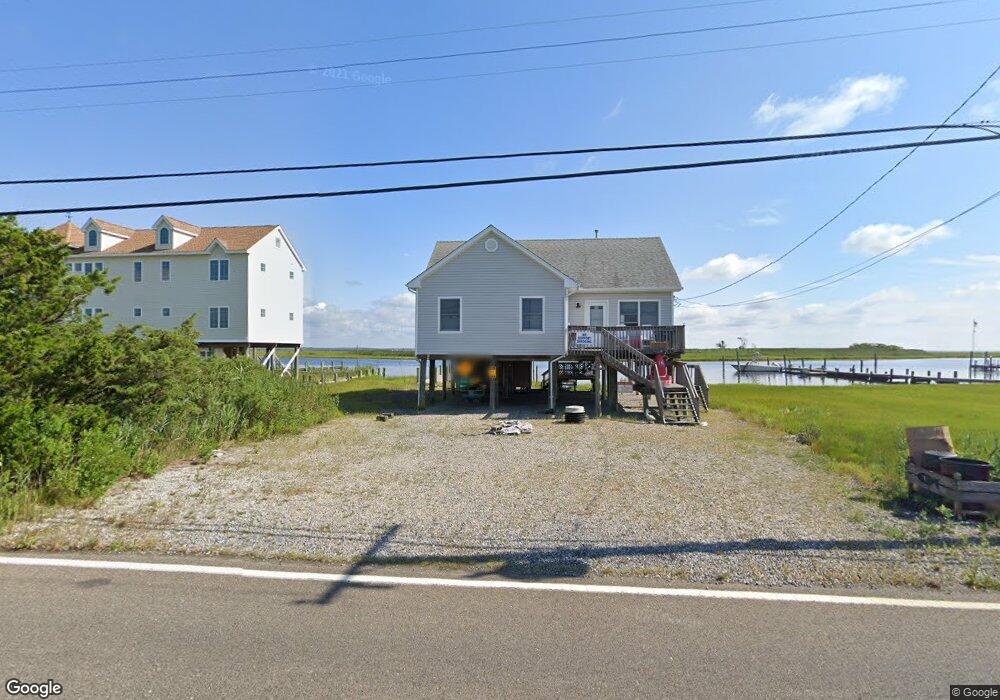
450 Dock Rd West Creek, NJ 08092
Eaglewood NeighborhoodEstimated Value: $332,573 - $484,000
3
Beds
2
Baths
1,165
Sq Ft
$342/Sq Ft
Est. Value
About This Home
This home is located at 450 Dock Rd, West Creek, NJ 08092 and is currently estimated at $398,143, approximately $341 per square foot. 450 Dock Rd is a home located in Ocean County with nearby schools including Eagleswood Elementary School, Pinelands Regional Junior High School, and Pinelands Regional High School.
Ownership History
Date
Name
Owned For
Owner Type
Purchase Details
Closed on
Jul 27, 2015
Sold by
Grath Robert F Mc and Grath Bernadette E Mc
Bought by
Grath Elaine Patrice Mc
Current Estimated Value
Purchase Details
Closed on
Aug 1, 1999
Sold by
Becker Joseph F and Becker Catherine A
Bought by
Mcgrath Robert F and Mcgrath Bernadette E
Home Financials for this Owner
Home Financials are based on the most recent Mortgage that was taken out on this home.
Original Mortgage
$87,000
Interest Rate
7.75%
Mortgage Type
Seller Take Back
Create a Home Valuation Report for This Property
The Home Valuation Report is an in-depth analysis detailing your home's value as well as a comparison with similar homes in the area
Home Values in the Area
Average Home Value in this Area
Purchase History
| Date | Buyer | Sale Price | Title Company |
|---|---|---|---|
| Grath Elaine Patrice Mc | $175,000 | First American Title Ins Co | |
| Mcgrath Robert F | $112,000 | -- |
Source: Public Records
Mortgage History
| Date | Status | Borrower | Loan Amount |
|---|---|---|---|
| Closed | Mcgrath Robert F | $87,000 |
Source: Public Records
Tax History Compared to Growth
Tax History
| Year | Tax Paid | Tax Assessment Tax Assessment Total Assessment is a certain percentage of the fair market value that is determined by local assessors to be the total taxable value of land and additions on the property. | Land | Improvement |
|---|---|---|---|---|
| 2025 | $4,892 | $177,700 | $95,200 | $82,500 |
| 2024 | $4,873 | $177,700 | $95,200 | $82,500 |
| 2023 | $4,750 | $177,700 | $95,200 | $82,500 |
| 2022 | $4,750 | $177,700 | $95,200 | $82,500 |
| 2021 | $4,725 | $177,700 | $95,200 | $82,500 |
| 2020 | $4,819 | $177,700 | $95,200 | $82,500 |
| 2019 | $4,674 | $177,700 | $95,200 | $82,500 |
| 2018 | $4,359 | $177,700 | $95,200 | $82,500 |
| 2017 | $6,636 | $271,200 | $190,500 | $80,700 |
| 2016 | $6,417 | $271,200 | $190,500 | $80,700 |
| 2015 | $5,914 | $271,200 | $190,500 | $80,700 |
| 2014 | $5,711 | $271,200 | $190,500 | $80,700 |
Source: Public Records
Map
Nearby Homes