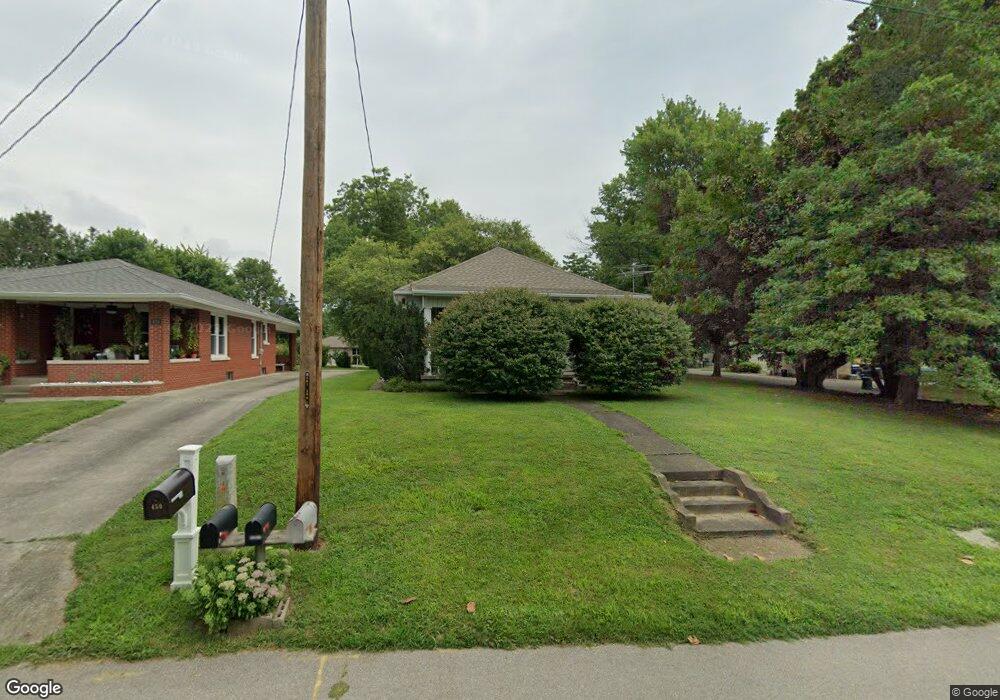
450 E Walnut St Elberfeld, IN 47613
Estimated Value: $157,000 - $240,000
3
Beds
2
Baths
1,152
Sq Ft
$165/Sq Ft
Est. Value
About This Home
This home is located at 450 E Walnut St, Elberfeld, IN 47613 and is currently estimated at $190,255, approximately $165 per square foot. 450 E Walnut St is a home located in Warrick County with nearby schools including Elberfeld Elementary School and Tecumseh High School.
Ownership History
Date
Name
Owned For
Owner Type
Purchase Details
Closed on
Aug 1, 2024
Sold by
Turner Phillip A and Turner Victoria A
Bought by
King Emma L
Current Estimated Value
Home Financials for this Owner
Home Financials are based on the most recent Mortgage that was taken out on this home.
Original Mortgage
$208,690
Outstanding Balance
$205,373
Interest Rate
6.87%
Mortgage Type
New Conventional
Estimated Equity
-$15,118
Purchase Details
Closed on
Jun 7, 2023
Sold by
Household Thoughts Llc
Bought by
Turner Phillip A and Turner Victoria A
Home Financials for this Owner
Home Financials are based on the most recent Mortgage that was taken out on this home.
Original Mortgage
$160,880
Interest Rate
6.73%
Mortgage Type
Construction
Purchase Details
Closed on
Jun 5, 2023
Sold by
Ashby Randall Thomas and Ashby Brenda Kaye
Bought by
Ashby Eskel Terry and Ashby Debra Jean
Home Financials for this Owner
Home Financials are based on the most recent Mortgage that was taken out on this home.
Original Mortgage
$160,880
Interest Rate
6.73%
Mortgage Type
Construction
Purchase Details
Closed on
Jun 2, 2023
Sold by
Ashby Eskel Terry and Ashby Debra Jean
Bought by
Ashby Randall Thomas and Ashby Brenda Kaye
Home Financials for this Owner
Home Financials are based on the most recent Mortgage that was taken out on this home.
Original Mortgage
$160,880
Interest Rate
6.73%
Mortgage Type
Construction
Purchase Details
Closed on
Apr 14, 2023
Sold by
Neier David Brett
Bought by
Household Thoughts Llc
Home Financials for this Owner
Home Financials are based on the most recent Mortgage that was taken out on this home.
Original Mortgage
$160,880
Interest Rate
6.73%
Mortgage Type
Construction
Purchase Details
Closed on
Dec 20, 2022
Sold by
Oakland Holdings Llc
Bought by
Jernic Homes Llc
Create a Home Valuation Report for This Property
The Home Valuation Report is an in-depth analysis detailing your home's value as well as a comparison with similar homes in the area
Purchase History
| Date | Buyer | Sale Price | Title Company |
|---|---|---|---|
| King Emma L | $206,604 | None Listed On Document | |
| Turner Phillip A | -- | None Listed On Document | |
| Ashby Eskel Terry | -- | None Listed On Document | |
| Ashby Randall Thomas | -- | None Listed On Document | |
| Household Thoughts Llc | -- | None Listed On Document | |
| Jernic Homes Llc | -- | None Listed On Document |
Source: Public Records
Mortgage History
| Date | Status | Borrower | Loan Amount |
|---|---|---|---|
| Open | King Emma L | $208,690 | |
| Previous Owner | Household Thoughts Llc | $160,880 |
Source: Public Records
Tax History
| Year | Tax Paid | Tax Assessment Tax Assessment Total Assessment is a certain percentage of the fair market value that is determined by local assessors to be the total taxable value of land and additions on the property. | Land | Improvement |
|---|---|---|---|---|
| 2025 | $636 | $120,700 | $27,000 | $93,700 |
| 2024 | $636 | $106,600 | $27,000 | $79,600 |
| 2023 | $1,819 | $99,700 | $11,500 | $88,200 |
| 2022 | $1,790 | $98,100 | $11,500 | $86,600 |
| 2021 | $1,613 | $80,600 | $11,500 | $69,100 |
| 2020 | $1,444 | $72,100 | $11,500 | $60,600 |
| 2019 | $1,421 | $70,900 | $11,500 | $59,400 |
| 2018 | $1,350 | $67,400 | $11,500 | $55,900 |
| 2017 | $1,376 | $68,700 | $11,500 | $57,200 |
| 2016 | $1,368 | $68,300 | $11,500 | $56,800 |
| 2014 | $1,374 | $68,600 | $11,500 | $57,100 |
| 2013 | $1,417 | $70,800 | $11,400 | $59,400 |
Source: Public Records
Map
Nearby Homes
- New Harmony Rd
- 375 W Main St
- 355 W Walnut St
- 470 Mulberry St
- 1300 S County Rd
- 11499 Nobles Chapel Rd
- 11522 Nobles Chapel Rd
- 9264 Indiana 57
- 4710 Lemon Grass Ct
- 4615 Verbena Ln
- 14219 Hemlock Ln
- 4635 Spanish Moss Blvd
- 4501 Verbena Ln
- 13918 Persimmon Ln
- 2352 E Warrenton Rd
- 18530 Somerville Ct
- 3699 Asbury Cemetery Rd
- 13800 Prairie Dr
- 10144 Fisherville Rd
- 13621 Prairie Dr
Your Personal Tour Guide
Ask me questions while you tour the home.