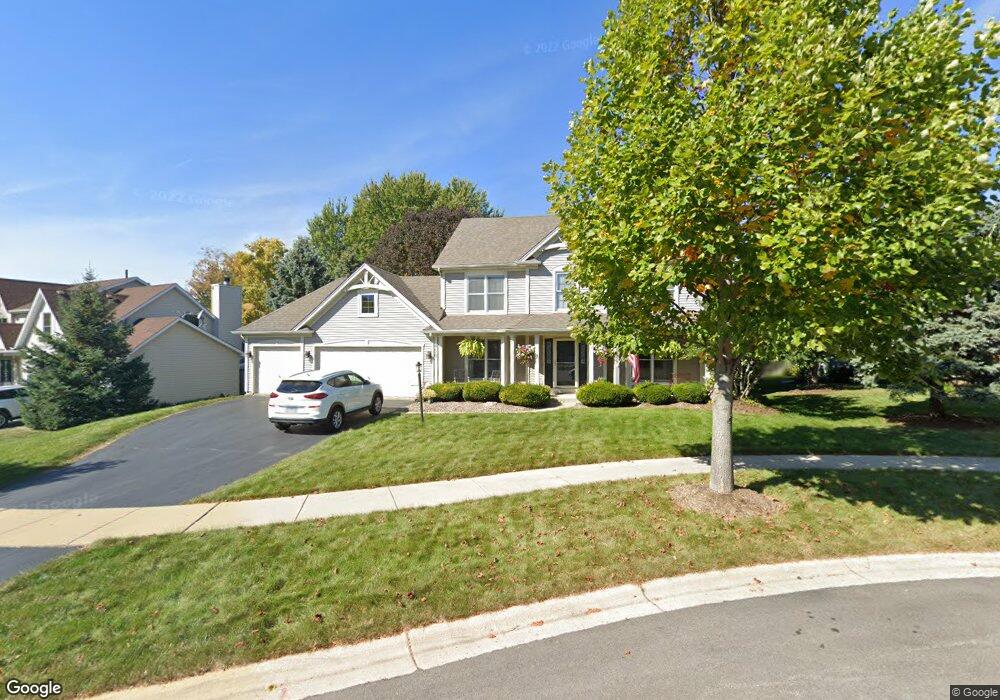
450 Erickson Ct Elburn, IL 60119
Estimated Value: $423,009 - $452,000
4
Beds
3
Baths
2,241
Sq Ft
$194/Sq Ft
Est. Value
About This Home
This home is located at 450 Erickson Ct, Elburn, IL 60119 and is currently estimated at $435,252, approximately $194 per square foot. 450 Erickson Ct is a home located in Kane County with nearby schools including Kaneland John Stewart Elementary School, Harter Middle School, and Kaneland Senior High School.
Ownership History
Date
Name
Owned For
Owner Type
Purchase Details
Closed on
Apr 2, 2008
Sold by
Faron Joseph J and Faron Rosanne M
Bought by
Laudont Timothy J and Laudont Clare P
Current Estimated Value
Home Financials for this Owner
Home Financials are based on the most recent Mortgage that was taken out on this home.
Original Mortgage
$297,350
Outstanding Balance
$189,535
Interest Rate
6.09%
Mortgage Type
Purchase Money Mortgage
Estimated Equity
$245,717
Purchase Details
Closed on
Nov 4, 2000
Sold by
Faron Joseph J
Bought by
Faron Joseph J and Faron Rosanne M
Purchase Details
Closed on
Sep 27, 1996
Sold by
Sleeth Builders Inc
Bought by
Faron Joseph J
Home Financials for this Owner
Home Financials are based on the most recent Mortgage that was taken out on this home.
Original Mortgage
$154,100
Interest Rate
7.75%
Create a Home Valuation Report for This Property
The Home Valuation Report is an in-depth analysis detailing your home's value as well as a comparison with similar homes in the area
Home Values in the Area
Average Home Value in this Area
Purchase History
| Date | Buyer | Sale Price | Title Company |
|---|---|---|---|
| Laudont Timothy J | $313,000 | Chicago Title Insurance Co | |
| Faron Joseph J | -- | -- | |
| Faron Joseph J | $205,500 | Chicago Title Insurance Co |
Source: Public Records
Mortgage History
| Date | Status | Borrower | Loan Amount |
|---|---|---|---|
| Open | Laudont Timothy J | $297,350 | |
| Previous Owner | Faron Joseph J | $154,100 |
Source: Public Records
Tax History Compared to Growth
Tax History
| Year | Tax Paid | Tax Assessment Tax Assessment Total Assessment is a certain percentage of the fair market value that is determined by local assessors to be the total taxable value of land and additions on the property. | Land | Improvement |
|---|---|---|---|---|
| 2024 | $9,690 | $118,399 | $20,651 | $97,748 |
| 2023 | $9,434 | $105,855 | $18,463 | $87,392 |
| 2022 | $9,100 | $96,451 | $16,823 | $79,628 |
| 2021 | $8,728 | $91,069 | $15,884 | $75,185 |
| 2020 | $8,661 | $89,758 | $15,655 | $74,103 |
| 2019 | $8,655 | $88,440 | $15,425 | $73,015 |
| 2018 | $8,792 | $88,440 | $15,425 | $73,015 |
| 2017 | $8,741 | $87,142 | $15,199 | $71,943 |
| 2016 | $8,740 | $84,942 | $14,815 | $70,127 |
| 2015 | -- | $82,596 | $14,406 | $68,190 |
| 2014 | -- | $83,862 | $14,627 | $69,235 |
| 2013 | -- | $85,269 | $14,872 | $70,397 |
Source: Public Records
Map
Nearby Homes
- 653 Downing St
- 524 Highland Dr
- 407 E Willow St Unit 407
- 630 Maple Ct Unit 2
- The Aspen - Front Load Plan at Williams Ridge
- The Halsted Plan at Williams Ridge
- The Superior Plan at Williams Ridge
- The Varner Plan at Williams Ridge
- The Williamson Plan at Williams Ridge
- The Westwood Plan at Williams Ridge
- The Lincoln Plan at Williams Ridge
- The Ontario Plan at Williams Ridge
- The Ashbury Plan at Williams Ridge
- The Bettendorf Plan at Williams Ridge
- The Erie Plan at Williams Ridge
- The Braxton Plan at Williams Ridge
- The Haven Plan at Williams Ridge
- Lot 78 Houtz Cir
- Lot 79 Houtz Cir
- Lot 77 Houtz Cir
- 442 Erickson Ct
- 458 Erickson Ct
- 710 Highview Ct
- 711 Highview Ct
- 434 Erickson Ct
- 466 Erickson Ct
- 718 Highview Ct
- 459 Erickson Ct
- 474 Erickson Ct
- 721 Highview Ct
- 451 Erickson Ct
- 631 Highland Dr
- 467 Erickson Ct
- 641 Highland Dr
- 640 Downing Ct
- 644 Downing Ct
- 483 Erickson Ct
- 443 Erickson Ct
- 726 Highview Ct
- 475 Erickson Ct Unit 4