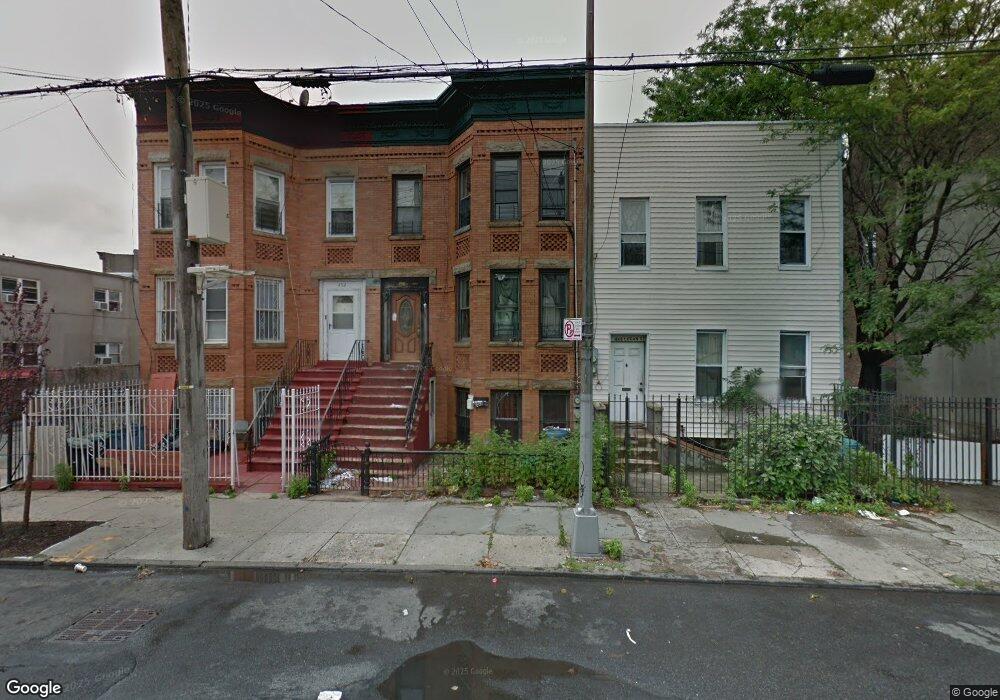
450 Logan St Brooklyn, NY 11208
East New York NeighborhoodEstimated Value: $946,000 - $978,000
5
Beds
2
Baths
3,120
Sq Ft
$308/Sq Ft
Est. Value
About This Home
This home is located at 450 Logan St, Brooklyn, NY 11208 and is currently estimated at $962,260, approximately $308 per square foot. 450 Logan St is a home located in Kings County with nearby schools including P.S. 345 Patrolman Robert Bolden, Liberty Avenue Middle School, and Vista Academy.
Ownership History
Date
Name
Owned For
Owner Type
Purchase Details
Closed on
Jun 4, 2015
Sold by
Lasanni Llc
Bought by
Malik Abdul and Nahar Nurun
Current Estimated Value
Home Financials for this Owner
Home Financials are based on the most recent Mortgage that was taken out on this home.
Original Mortgage
$412,500
Outstanding Balance
$318,701
Interest Rate
3.84%
Mortgage Type
New Conventional
Estimated Equity
$643,559
Purchase Details
Closed on
Jul 22, 2014
Sold by
Hinds Fabia J
Bought by
Lasanni Llc
Purchase Details
Closed on
Mar 9, 2006
Sold by
Hernandez Alberto and Hernandez Jesus
Bought by
Hinds Fabia J
Home Financials for this Owner
Home Financials are based on the most recent Mortgage that was taken out on this home.
Original Mortgage
$118,600
Interest Rate
6.28%
Purchase Details
Closed on
May 28, 2002
Sold by
Magazine Curtis
Bought by
Hernandez Alberto and Hernandez Jesus
Home Financials for this Owner
Home Financials are based on the most recent Mortgage that was taken out on this home.
Original Mortgage
$226,100
Interest Rate
6.8%
Create a Home Valuation Report for This Property
The Home Valuation Report is an in-depth analysis detailing your home's value as well as a comparison with similar homes in the area
Home Values in the Area
Average Home Value in this Area
Purchase History
| Date | Buyer | Sale Price | Title Company |
|---|---|---|---|
| Malik Abdul | $550,000 | -- | |
| Malik Abdul | $550,000 | -- | |
| Lasanni Llc | $310,000 | -- | |
| Lasanni Llc | $310,000 | -- | |
| Hinds Fabia J | $593,000 | -- | |
| Hinds Fabia J | $593,000 | -- | |
| Hernandez Alberto | -- | -- | |
| Hernandez Alberto | -- | -- |
Source: Public Records
Mortgage History
| Date | Status | Borrower | Loan Amount |
|---|---|---|---|
| Open | Malik Abdul | $412,500 | |
| Closed | Malik Abdul | $412,500 | |
| Previous Owner | Hinds Fabia J | $118,600 | |
| Previous Owner | Hinds Fabia J | $474,400 | |
| Previous Owner | Hernandez Alberto | $226,100 |
Source: Public Records
Tax History
| Year | Tax Paid | Tax Assessment Tax Assessment Total Assessment is a certain percentage of the fair market value that is determined by local assessors to be the total taxable value of land and additions on the property. | Land | Improvement |
|---|---|---|---|---|
| 2025 | $2,770 | $65,040 | $10,080 | $54,960 |
| 2024 | $2,770 | $51,360 | $10,080 | $41,280 |
| 2023 | $2,648 | $52,980 | $10,080 | $42,900 |
| 2022 | $2,460 | $58,080 | $10,080 | $48,000 |
| 2021 | $2,450 | $59,640 | $10,080 | $49,560 |
| 2020 | $602 | $48,120 | $10,080 | $38,040 |
| 2019 | $2,404 | $48,120 | $10,080 | $38,040 |
| 2018 | $2,215 | $10,866 | $2,749 | $8,117 |
| 2017 | $2,093 | $10,268 | $2,334 | $7,934 |
| 2016 | $1,940 | $9,703 | $2,865 | $6,838 |
| 2015 | $1,168 | $9,703 | $2,559 | $7,144 |
| 2014 | $1,168 | $9,578 | $3,029 | $6,549 |
Source: Public Records
Map
Nearby Homes
- 447 Logan St
- 900 Glenmore Ave
- 196 Fountain Ave
- 184 Milford St
- 404 Logan St
- 126 Crystal St
- 852 Glenmore Ave
- 2540 Pitkin Ave
- 210 Montauk Ave
- 127 Crystal St
- 851 Glenmore Ave
- 170 Atkins Ave
- 194 Crystal St
- 166 Atkins Ave
- 208 Atkins Ave
- 928 Belmont Ave
- 356 Logan St
- 414 Chestnut St
- 842 Belmont Ave
- 195 Berriman St
- 448 Logan St
- 446 Logan St
- 452 Logan St
- 440 Logan St
- 2593 Pitkin Ave
- 2593 Pitkin Ave Unit 2
- 2597 Pitkin Ave
- 2591 Pitkin Ave
- 436 Logan St
- 2599 Pitkin Ave
- 183 Milford St
- 183 Milford St Unit MULTI-FAMILY
- 183 Milford St Unit 1
- 177 Milford St
- 2587 Pitkin Ave Unit 5
- 175 Milford St
- 2581 Pitkin Ave
- 432 Logan St
- 2583 Pitkin Ave
- 171-173 Milford St Unit 20
Your Personal Tour Guide
Ask me questions while you tour the home.