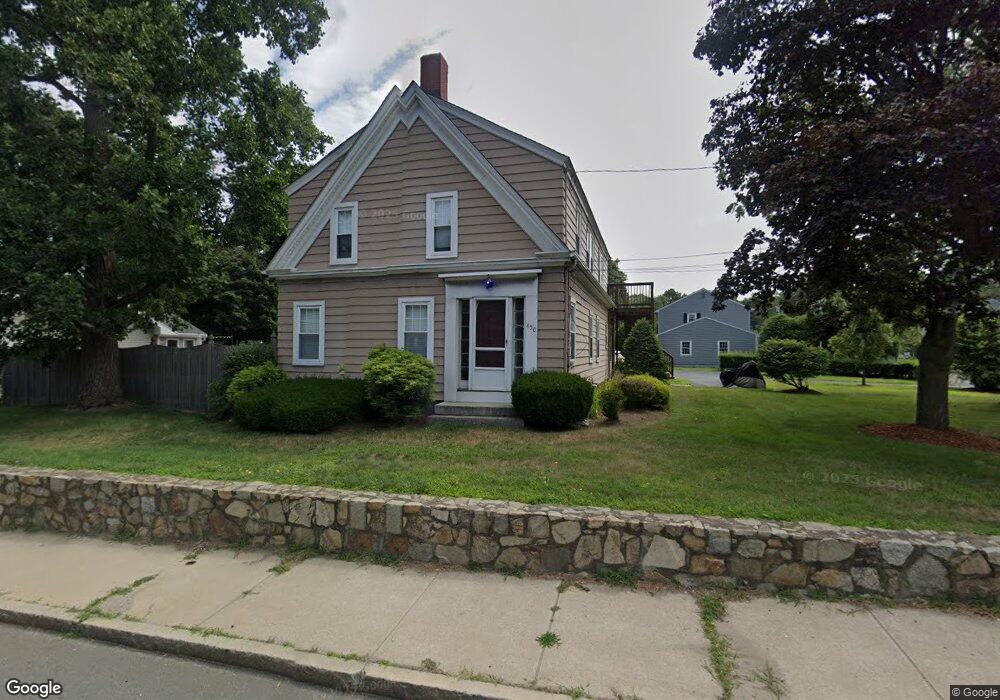
450 Main St Unit 2 South Weymouth, MA 02190
South Weymouth NeighborhoodEstimated Value: $658,746 - $911,000
1
Bed
1
Bath
950
Sq Ft
$841/Sq Ft
Est. Value
About This Home
This home is located at 450 Main St Unit 2, South Weymouth, MA 02190 and is currently estimated at $799,187, approximately $841 per square foot. 450 Main St Unit 2 is a home located in Norfolk County with nearby schools including Thomas V Nash, Abigail Adams Middle School, and Weymouth Middle School Chapman.
Ownership History
Date
Name
Owned For
Owner Type
Purchase Details
Closed on
Oct 31, 1995
Sold by
Pratt Exr George F
Bought by
Wyman Michael J and Wyman Suzanne G
Current Estimated Value
Home Financials for this Owner
Home Financials are based on the most recent Mortgage that was taken out on this home.
Original Mortgage
$128,268
Interest Rate
7.6%
Mortgage Type
Purchase Money Mortgage
Create a Home Valuation Report for This Property
The Home Valuation Report is an in-depth analysis detailing your home's value as well as a comparison with similar homes in the area
Home Values in the Area
Average Home Value in this Area
Purchase History
| Date | Buyer | Sale Price | Title Company |
|---|---|---|---|
| Wyman Michael J | $130,000 | -- |
Source: Public Records
Mortgage History
| Date | Status | Borrower | Loan Amount |
|---|---|---|---|
| Open | Wyman Michael J | $180,000 | |
| Closed | Wyman Michael J | $125,800 | |
| Closed | Wyman Michael J | $22,844 | |
| Closed | Wyman Michael J | $128,268 |
Source: Public Records
Tax History Compared to Growth
Tax History
| Year | Tax Paid | Tax Assessment Tax Assessment Total Assessment is a certain percentage of the fair market value that is determined by local assessors to be the total taxable value of land and additions on the property. | Land | Improvement |
|---|---|---|---|---|
| 2025 | $5,828 | $577,000 | $188,200 | $388,800 |
| 2024 | $5,660 | $551,100 | $179,200 | $371,900 |
| 2023 | $5,697 | $545,200 | $186,100 | $359,100 |
| 2022 | $5,545 | $483,900 | $172,400 | $311,500 |
| 2021 | $5,065 | $431,400 | $153,700 | $277,700 |
| 2020 | $4,853 | $407,100 | $153,700 | $253,400 |
| 2019 | $4,738 | $390,900 | $147,800 | $243,100 |
| 2018 | $4,384 | $350,700 | $140,800 | $209,900 |
| 2017 | $4,244 | $331,300 | $134,200 | $197,100 |
| 2016 | $4,020 | $314,100 | $129,000 | $185,100 |
| 2015 | $3,891 | $301,600 | $129,000 | $172,600 |
| 2014 | $3,894 | $292,800 | $120,000 | $172,800 |
Source: Public Records
Map
Nearby Homes
- 2 Tara Dr Unit 1
- 200 Justin Dr Unit 3
- 2 Mitchell Ln Unit B
- 116 Belmont St
- 747 Middle St
- 200 Burkhall St Unit 803
- 200 Burkhall St Unit 102
- 215 Winter St Unit 1P
- 191 Tall Oaks Dr Unit C
- 255 West St
- 262 West St
- 120 Burkhall St Unit K
- 655 Summer St
- 110 Burkhall St Unit H
- 92 Mercury St
- 27 Park Ave
- 19 Saint Margaret St
- 501 Commerce Dr Unit 2310
- 501 Commerce Dr Unit 1111
- 501 Commerce Dr Unit 4206