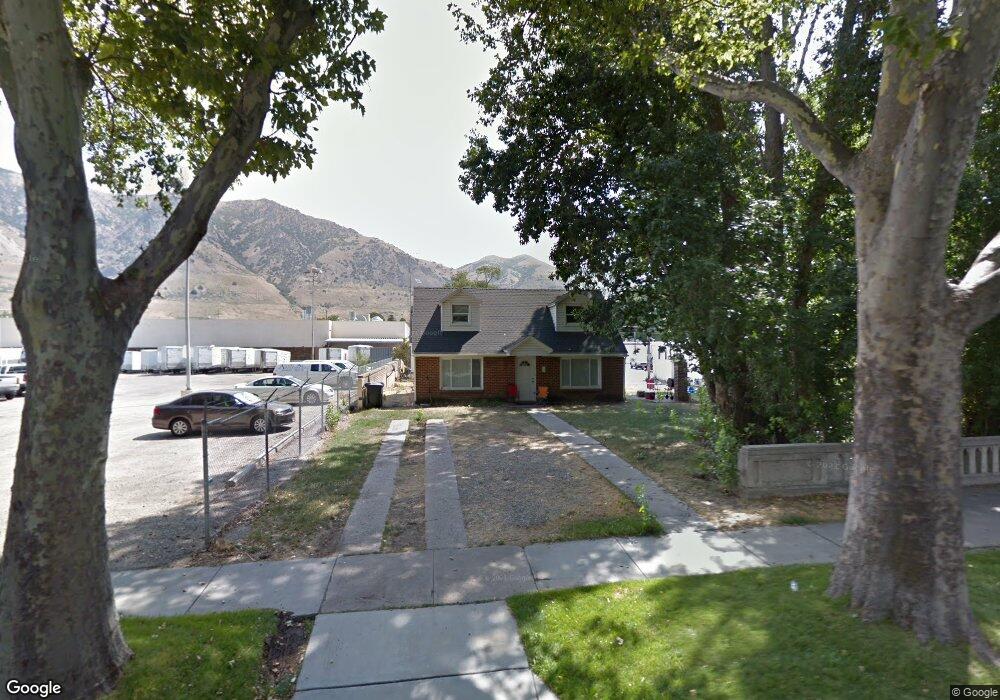
450 N Main St Brigham City, UT 84302
Estimated Value: $450,000 - $809,957
3
Beds
2
Baths
1,324
Sq Ft
$493/Sq Ft
Est. Value
About This Home
This home is located at 450 N Main St, Brigham City, UT 84302 and is currently estimated at $652,739, approximately $493 per square foot. 450 N Main St is a home located in Box Elder County with nearby schools including Box Elder Middle School, Adele C. Young Intermediate School, and Box Elder High School.
Ownership History
Date
Name
Owned For
Owner Type
Purchase Details
Closed on
Aug 4, 2021
Sold by
Boulder Ranch Lc
Bought by
Brigham Village Llc
Current Estimated Value
Home Financials for this Owner
Home Financials are based on the most recent Mortgage that was taken out on this home.
Original Mortgage
$1,575,000
Outstanding Balance
$1,432,163
Interest Rate
2.9%
Mortgage Type
Commercial
Estimated Equity
-$779,424
Create a Home Valuation Report for This Property
The Home Valuation Report is an in-depth analysis detailing your home's value as well as a comparison with similar homes in the area
Home Values in the Area
Average Home Value in this Area
Purchase History
| Date | Buyer | Sale Price | Title Company |
|---|---|---|---|
| Brigham Village Llc | -- | Metro National Title | |
| Brigham Village Llc | -- | Metro National Title |
Source: Public Records
Mortgage History
| Date | Status | Borrower | Loan Amount |
|---|---|---|---|
| Open | Brigham Village Llc | $1,575,000 | |
| Closed | Brigham Village Llc | $1,575,000 |
Source: Public Records
Tax History Compared to Growth
Tax History
| Year | Tax Paid | Tax Assessment Tax Assessment Total Assessment is a certain percentage of the fair market value that is determined by local assessors to be the total taxable value of land and additions on the property. | Land | Improvement |
|---|---|---|---|---|
| 2025 | $4,558 | $821,755 | $446,128 | $375,627 |
| 2024 | $4,558 | $824,428 | $441,128 | $383,300 |
| 2023 | $4,524 | $833,262 | $436,128 | $397,134 |
| 2022 | $1,583 | $257,778 | $50,900 | $206,878 |
| 2021 | $1,484 | $211,006 | $50,900 | $160,106 |
| 2020 | $1,505 | $211,006 | $50,900 | $160,106 |
| 2019 | $1,460 | $74,212 | $10,900 | $63,312 |
| 2018 | $1,373 | $117,983 | $32,900 | $85,083 |
| 2017 | $1,221 | $148,177 | $18,600 | $123,277 |
| 2016 | $1,295 | $97,474 | $18,600 | $78,874 |
| 2015 | $1,217 | $90,303 | $18,600 | $71,703 |
| 2014 | $1,217 | $88,189 | $18,600 | $69,589 |
| 2013 | -- | $88,189 | $18,600 | $69,589 |
Source: Public Records
Map
Nearby Homes
- 410 N Main St Unit 13
- 410 N Main St Unit 44
- 410 N Main St Unit 6
- 410 N Main St
- 410 N Main St Unit 26
- 410 N Main St Unit 10
- 410 N Main St Unit 7
- 410 N Main St Unit 34
- 410 N Main St Unit 5
- 410 N Main St Unit 43
- 410 N Main St Unit 42
- 439 N Main St
- 467 N Main St
- 435 N Main St
- 423 N Main St
- 454 N 100 W
- 452 N 100 E
- 458 N 100 E
- 464 N 100 W
- 450 N 100 E