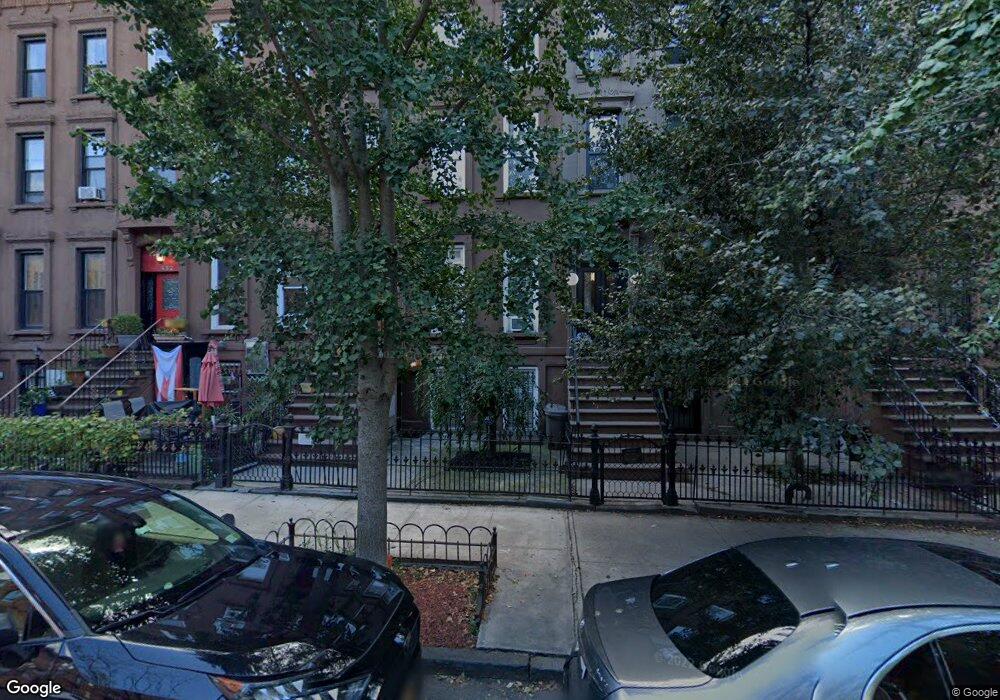
450 Putnam Ave Brooklyn, NY 11221
Bed-Stuy NeighborhoodEstimated Value: $1,520,000 - $2,554,000
--
Bed
--
Bath
3,760
Sq Ft
$486/Sq Ft
Est. Value
About This Home
This home is located at 450 Putnam Ave, Brooklyn, NY 11221 and is currently estimated at $1,827,086, approximately $485 per square foot. 450 Putnam Ave is a home located in Kings County with nearby schools including P.S. 44 Marcus Garvey, Brooklyn East Collegiate Charter School, and Leadership Preparatory Bedford Stuyvesant Charter School.
Ownership History
Date
Name
Owned For
Owner Type
Purchase Details
Closed on
Mar 31, 2022
Sold by
Janvier Alphonse and Janvier Denia
Bought by
450 Putnam Avenue Llc
Current Estimated Value
Purchase Details
Closed on
Jan 18, 2006
Sold by
Third Stage Inc
Bought by
Janvier Alphonse and Richardson Denia G
Home Financials for this Owner
Home Financials are based on the most recent Mortgage that was taken out on this home.
Original Mortgage
$77,000
Interest Rate
6.31%
Purchase Details
Closed on
Jul 18, 2005
Sold by
Fanniemae and International Plaza Ii
Bought by
Third Stage Inc
Purchase Details
Closed on
Dec 13, 2004
Sold by
Sass Paul
Bought by
Federal National Mortgage Association
Purchase Details
Closed on
May 22, 2002
Sold by
Wheeler William Hr and Wheeler Robert Hr
Bought by
Universal Development Ll
Purchase Details
Closed on
Mar 21, 1997
Sold by
Sheard Bessie
Bought by
Sheard Bessie and Wheeler William
Create a Home Valuation Report for This Property
The Home Valuation Report is an in-depth analysis detailing your home's value as well as a comparison with similar homes in the area
Home Values in the Area
Average Home Value in this Area
Purchase History
| Date | Buyer | Sale Price | Title Company |
|---|---|---|---|
| 450 Putnam Avenue Llc | -- | -- | |
| 450 Putnam Avenue Llc | -- | -- | |
| Janvier Alphonse | $770,500 | -- | |
| Janvier Alphonse | $770,500 | -- | |
| Third Stage Inc | $550,000 | -- | |
| Third Stage Inc | $550,000 | -- | |
| Federal National Mortgage Association | $474,374 | -- | |
| Federal National Mortgage Association | $474,374 | -- | |
| Universal Development Ll | -- | -- | |
| Universal Development Ll | -- | -- | |
| Sheard Bessie | -- | Chicago Title Insurance Co | |
| Sheard Bessie | -- | Chicago Title Insurance Co |
Source: Public Records
Mortgage History
| Date | Status | Borrower | Loan Amount |
|---|---|---|---|
| Previous Owner | Janvier Alphonse | $77,000 | |
| Previous Owner | Janvier Alphonse | $616,000 |
Source: Public Records
Tax History Compared to Growth
Tax History
| Year | Tax Paid | Tax Assessment Tax Assessment Total Assessment is a certain percentage of the fair market value that is determined by local assessors to be the total taxable value of land and additions on the property. | Land | Improvement |
|---|---|---|---|---|
| 2025 | $5,008 | $89,400 | $16,380 | $73,020 |
| 2024 | $5,008 | $105,180 | $16,380 | $88,800 |
| 2023 | $4,780 | $106,500 | $16,380 | $90,120 |
| 2022 | $4,434 | $116,700 | $16,380 | $100,320 |
| 2021 | $4,114 | $118,800 | $16,380 | $102,420 |
| 2020 | $2,044 | $96,120 | $16,380 | $79,740 |
| 2019 | $4,054 | $96,120 | $16,380 | $79,740 |
| 2018 | $3,701 | $19,615 | $3,042 | $16,573 |
| 2017 | $3,474 | $18,511 | $3,250 | $15,261 |
| 2016 | $3,181 | $17,464 | $4,139 | $13,325 |
| 2015 | $1,886 | $17,464 | $4,811 | $12,653 |
| 2014 | $1,886 | $17,317 | $5,724 | $11,593 |
Source: Public Records
Map
Nearby Homes
- 435 Putnam Ave Unit TH
- 358 Tompkins Ave Unit GARDEN
- 327 Jefferson Ave
- 400 Putnam Ave
- 408 Madison St
- 355 Monroe St
- 259 Halsey St Unit 2R
- 259 Halsey St Unit 3R
- 259 Halsey St Unit 3F
- 259 Halsey St Unit 2F
- 259 Halsey St Unit 1R
- 259 Halsey St Unit 4R
- 408 Monroe St
- 280 Hancock St
- 370 Hancock St
- 370 Hancock St Unit TWNHS
- 263 Hancock St
- 277 Jefferson Ave
- 318 Halsey St
- 384 Hancock St
- 448 Putnam Ave
- 452 Putnam Ave
- 446 Putnam Ave
- 444 Putnam Ave
- 456 Putnam Ave
- 454 Putnam Ave
- 458 Putnam Ave
- 458 Putnam Ave Unit HOUSE
- 442 Putnam Ave
- 460 Putnam Ave
- 440 Putnam Ave
- 367 Jefferson Ave
- 363 Jefferson Ave
- 363 Jefferson Ave Unit 3
- 361 Jefferson Ave
- 361 Jefferson Ave Unit House
- 361 Jefferson Ave Unit 3
- 361 Jefferson Ave Unit 1
- 369A Jefferson Ave
- 438 Putnam Ave