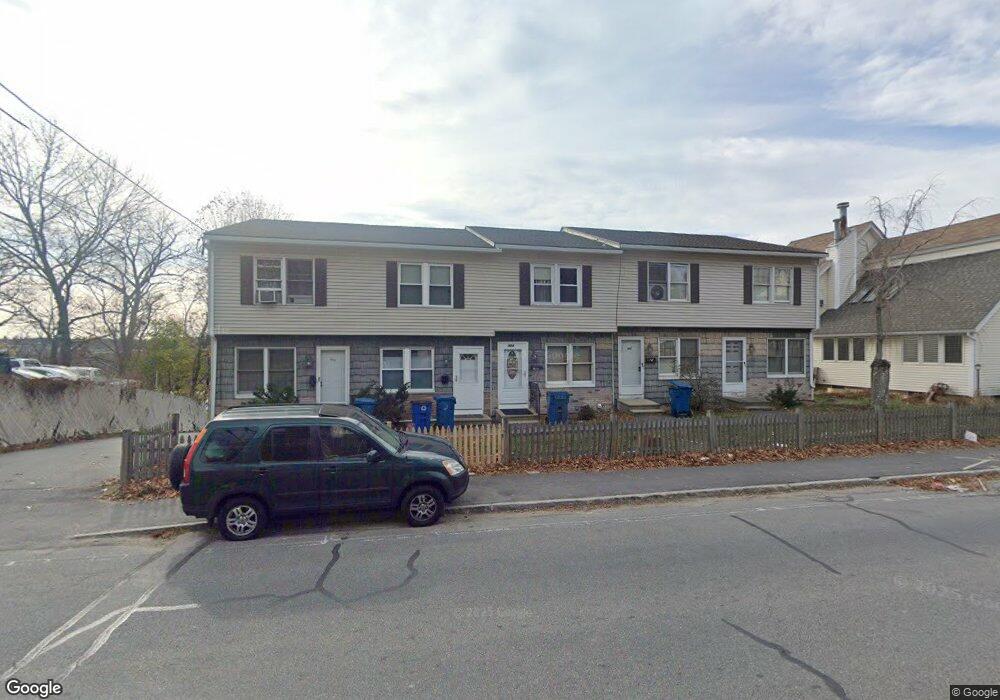
450 Riverside Dr Unit 458 Lawrence, MA 01841
Tower Hill NeighborhoodEstimated Value: $272,000 - $382,000
2
Beds
2
Baths
905
Sq Ft
$342/Sq Ft
Est. Value
About This Home
This home is located at 450 Riverside Dr Unit 458, Lawrence, MA 01841 and is currently estimated at $309,426, approximately $341 per square foot. 450 Riverside Dr Unit 458 is a home located in Essex County with nearby schools including Gerard A. Guilmette School, School For Exceptional Studies, and Lawrence Family Development Charter School.
Ownership History
Date
Name
Owned For
Owner Type
Purchase Details
Closed on
May 21, 2018
Sold by
Ezzi Holdings Llc
Bought by
Grullon Caonabo
Current Estimated Value
Home Financials for this Owner
Home Financials are based on the most recent Mortgage that was taken out on this home.
Original Mortgage
$185,000
Outstanding Balance
$160,984
Interest Rate
4.4%
Mortgage Type
New Conventional
Estimated Equity
$104,972
Purchase Details
Closed on
Mar 30, 2018
Sold by
Abou-Ezzi Marc
Bought by
Series A Ezzi Holdings
Home Financials for this Owner
Home Financials are based on the most recent Mortgage that was taken out on this home.
Original Mortgage
$185,000
Outstanding Balance
$160,984
Interest Rate
4.4%
Mortgage Type
New Conventional
Estimated Equity
$104,972
Purchase Details
Closed on
Apr 11, 2017
Sold by
Kopicko Francis L
Bought by
Wilmington T Na Tr
Purchase Details
Closed on
May 2, 1991
Sold by
New Heritage Holdings
Bought by
Kopicko Francis L
Create a Home Valuation Report for This Property
The Home Valuation Report is an in-depth analysis detailing your home's value as well as a comparison with similar homes in the area
Home Values in the Area
Average Home Value in this Area
Purchase History
| Date | Buyer | Sale Price | Title Company |
|---|---|---|---|
| Grullon Caonabo | $190,000 | -- | |
| Series A Ezzi Holdings | -- | -- | |
| Wilmington T Na Tr | $75,690 | -- | |
| Kopicko Francis L | $70,000 | -- |
Source: Public Records
Mortgage History
| Date | Status | Borrower | Loan Amount |
|---|---|---|---|
| Open | Grullon Caonabo | $185,000 | |
| Closed | Kopicko Francis L | $0 |
Source: Public Records
Tax History Compared to Growth
Tax History
| Year | Tax Paid | Tax Assessment Tax Assessment Total Assessment is a certain percentage of the fair market value that is determined by local assessors to be the total taxable value of land and additions on the property. | Land | Improvement |
|---|---|---|---|---|
| 2025 | $1,646 | $187,000 | $0 | $187,000 |
| 2024 | $1,583 | $171,100 | $0 | $171,100 |
| 2023 | $1,716 | $168,900 | $0 | $168,900 |
| 2022 | $1,793 | $156,700 | $0 | $156,700 |
| 2021 | $1,709 | $139,300 | $0 | $139,300 |
| 2020 | $1,623 | $130,600 | $0 | $130,600 |
| 2019 | $1,673 | $122,300 | $0 | $122,300 |
| 2018 | $1,567 | $109,400 | $0 | $109,400 |
| 2017 | $1,378 | $89,800 | $0 | $89,800 |
| 2016 | $1,607 | $103,600 | $0 | $103,600 |
| 2015 | $1,566 | $103,600 | $0 | $103,600 |
Source: Public Records
Map
Nearby Homes
- 439-443 Riverside Dr
- 18 Ames St
- 1008 Essex St Unit 1010
- 749-751 Riverside Dr
- 312 Water St Unit 13
- 112-116 Hancock St
- 2 Lansdowne Ct
- 34-38 Milton St
- 45 Bodwell St
- 37 Tewksbury St Unit 39
- 46-48 Cypress Ave
- 55-59 Water St
- 40-42 Perry Ave
- 145 Water St
- 26 Margin St
- 8 Packard St
- 76 Tewksbury St
- 406-408 Lowell St
- 31 Madison St
- 866 Riverside Dr
- 452 Riverside Dr Unit 2
- 450 Riverside Dr Unit 458
- 456 Riverside Dr
- 450 Riverside Dr Unit 458
- 454 Riverside Dr Unit 454
- 454 Riverside Dr Unit 3
- 458 Riverside Dr
- 462 Riverside Dr
- 439 Riverside Dr Unit 2
- 439 Riverside Dr
- 441 Riverside Dr Unit 1
- 453 Riverside Dr Unit 455
- 453-455 Riverside Dr
- 476-478 Riverside Dr
- 433 Riverside Dr
- 7 Tower Hill St
- 461 Riverside Dr
- 459 Riverside Dr
- 66-68 Texas Ave
- 463 Riverside Dr