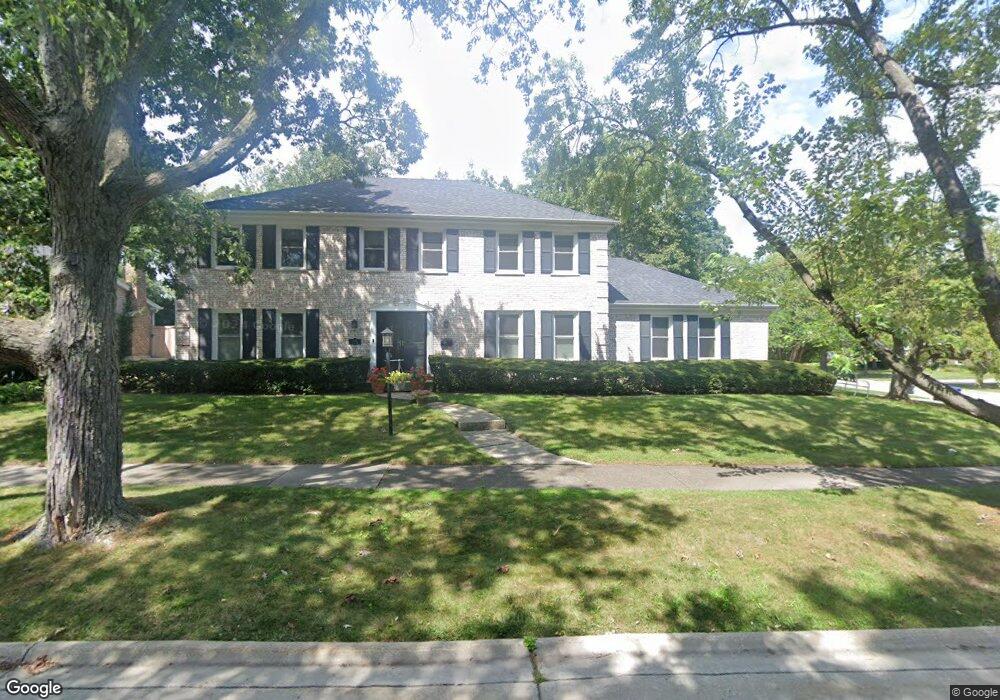
450 Shannon Rd Unit 2 Deerfield, IL 60015
Briarwood NeighborhoodEstimated Value: $985,000 - $1,103,382
5
Beds
4
Baths
3,094
Sq Ft
$337/Sq Ft
Est. Value
About This Home
This home is located at 450 Shannon Rd Unit 2, Deerfield, IL 60015 and is currently estimated at $1,043,846, approximately $337 per square foot. 450 Shannon Rd Unit 2 is a home located in Lake County with nearby schools including Kipling Elementary School, Alan B Shepard Middle School, and Deerfield High School.
Ownership History
Date
Name
Owned For
Owner Type
Purchase Details
Closed on
Jul 17, 2019
Sold by
Goldfinger Marks Ruth
Bought by
Marks Ruth G and The Ruth G Marks Declaration O
Current Estimated Value
Purchase Details
Closed on
Feb 27, 2015
Sold by
Marks John D and Goldfinger Marks Ruth
Bought by
Goldfinger Marks Ruth
Purchase Details
Closed on
May 22, 1995
Sold by
Firstar Bank Illinois
Bought by
Marks John D and Goldfinger Marks Ruth
Home Financials for this Owner
Home Financials are based on the most recent Mortgage that was taken out on this home.
Original Mortgage
$300,000
Interest Rate
8.26%
Create a Home Valuation Report for This Property
The Home Valuation Report is an in-depth analysis detailing your home's value as well as a comparison with similar homes in the area
Home Values in the Area
Average Home Value in this Area
Purchase History
| Date | Buyer | Sale Price | Title Company |
|---|---|---|---|
| Marks Ruth G | -- | Attorney | |
| Goldfinger Marks Ruth | -- | None Available | |
| Marks John D | $438,000 | Attorneys Natl Title Network |
Source: Public Records
Mortgage History
| Date | Status | Borrower | Loan Amount |
|---|---|---|---|
| Previous Owner | Marks John D | $300,000 |
Source: Public Records
Tax History Compared to Growth
Tax History
| Year | Tax Paid | Tax Assessment Tax Assessment Total Assessment is a certain percentage of the fair market value that is determined by local assessors to be the total taxable value of land and additions on the property. | Land | Improvement |
|---|---|---|---|---|
| 2024 | $20,840 | $254,068 | $76,056 | $178,012 |
| 2023 | $21,094 | $229,014 | $68,556 | $160,458 |
| 2022 | $21,094 | $228,172 | $75,313 | $152,859 |
| 2021 | $19,964 | $220,562 | $72,801 | $147,761 |
| 2020 | $19,163 | $220,562 | $72,801 | $147,761 |
| 2019 | $17,689 | $208,312 | $72,460 | $135,852 |
| 2018 | $18,408 | $225,639 | $80,206 | $145,433 |
| 2017 | $18,236 | $224,337 | $79,743 | $144,594 |
| 2016 | $17,550 | $213,573 | $75,917 | $137,656 |
| 2015 | $17,000 | $198,432 | $70,535 | $127,897 |
| 2014 | $16,199 | $183,963 | $85,090 | $98,873 |
| 2012 | $15,762 | $185,036 | $85,586 | $99,450 |
Source: Public Records
Map
Nearby Homes
- 95 Greenbriar Dr E
- 717 Brierhill Rd
- 1816 Rosemary Rd
- 75 Eastwood Dr
- 850 Evergreen Way
- 49 Larkdale Rd
- 805 Brand Ln
- 75 Mulberry Rd
- 810 Virginia Rd
- 1773 Winthrop Rd
- 666 Barberry Rd
- 1921 Beechnut Rd
- 513 Sumac Rd
- 757 Kipling Place
- 1075 Heather Rd
- 630 Hermitage Dr
- 1490 Avignon Ct
- 1744 Walnut Cir
- 860 Kenton Rd
- 606 Longfellow Ave
- 0 Sequoia Ln Unit 731832
- 0 Sequoia Ln Unit 709557
- 0 Sequoia Ln Unit 711290
- 0 Sequoia Ln Unit 862956
- 0 Sequoia Ln Unit 1251698
- 0 Sequoia Ln Unit 1251694
- 0 Sequoia Ln Unit 1342266
- 470 Shannon Rd
- 420 Shannon Rd
- 475 Carlisle Ave
- 435 Carlisle Ave
- 435 Shannon Rd
- 445 Shannon Rd
- 490 Shannon Rd
- 455 Shannon Rd
- 465 Shannon Rd
- 485 Carlisle Ave
- 415 Carlisle Ave
- 485 Shannon Rd
- 65 Kildare Ln