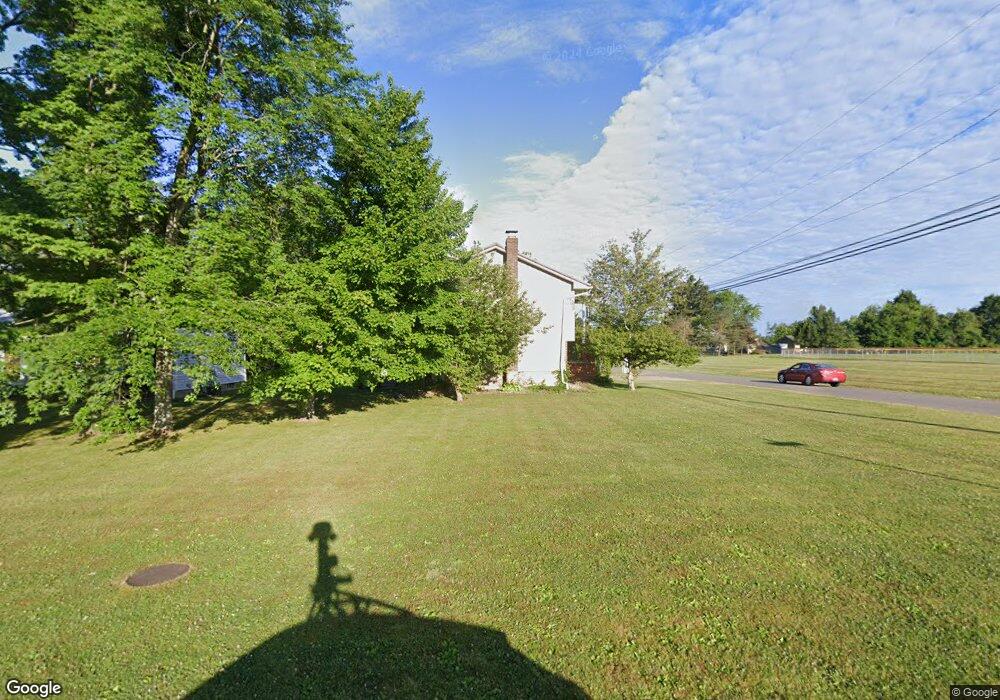
450 Sleepy Hollow Dr Leetonia, OH 44431
Estimated Value: $199,000 - $222,529
3
Beds
3
Baths
1,652
Sq Ft
$130/Sq Ft
Est. Value
About This Home
This home is located at 450 Sleepy Hollow Dr, Leetonia, OH 44431 and is currently estimated at $214,632, approximately $129 per square foot. 450 Sleepy Hollow Dr is a home located in Columbiana County with nearby schools including Leetonia Elementary K-6, Leetonia Elementary School, and Leetonia Jr./Sr. High School.
Ownership History
Date
Name
Owned For
Owner Type
Purchase Details
Closed on
Aug 23, 2024
Sold by
Smith Cleone A
Bought by
Hanna Tim A and Hanna Nancy B
Current Estimated Value
Home Financials for this Owner
Home Financials are based on the most recent Mortgage that was taken out on this home.
Original Mortgage
$220,924
Outstanding Balance
$218,376
Interest Rate
6.77%
Mortgage Type
FHA
Estimated Equity
-$3,744
Purchase Details
Closed on
Mar 5, 2002
Sold by
Whitehead William E and Jaworski Kendra M
Bought by
Smith Edward G and Smith Cleone A
Home Financials for this Owner
Home Financials are based on the most recent Mortgage that was taken out on this home.
Original Mortgage
$49,400
Interest Rate
6.95%
Create a Home Valuation Report for This Property
The Home Valuation Report is an in-depth analysis detailing your home's value as well as a comparison with similar homes in the area
Home Values in the Area
Average Home Value in this Area
Purchase History
| Date | Buyer | Sale Price | Title Company |
|---|---|---|---|
| Hanna Tim A | $225,000 | None Listed On Document | |
| Hanna Tim A | $225,000 | None Listed On Document | |
| Smith Edward G | $51,200 | -- |
Source: Public Records
Mortgage History
| Date | Status | Borrower | Loan Amount |
|---|---|---|---|
| Open | Hanna Tim A | $220,924 | |
| Closed | Hanna Tim A | $220,924 | |
| Previous Owner | Smith Edward G | $49,400 |
Source: Public Records
Tax History Compared to Growth
Tax History
| Year | Tax Paid | Tax Assessment Tax Assessment Total Assessment is a certain percentage of the fair market value that is determined by local assessors to be the total taxable value of land and additions on the property. | Land | Improvement |
|---|---|---|---|---|
| 2024 | $1,710 | $48,130 | $4,060 | $44,070 |
| 2023 | $1,713 | $48,130 | $4,060 | $44,070 |
| 2022 | $1,719 | $48,130 | $4,060 | $44,070 |
| 2021 | $1,651 | $44,040 | $5,920 | $38,120 |
| 2020 | $1,691 | $44,040 | $5,920 | $38,120 |
| 2019 | $1,706 | $44,040 | $5,920 | $38,120 |
| 2018 | $1,677 | $40,040 | $5,390 | $34,650 |
| 2017 | $1,696 | $40,040 | $5,390 | $34,650 |
| 2016 | $1,677 | $40,530 | $6,580 | $33,950 |
| 2015 | $1,677 | $40,530 | $6,580 | $33,950 |
| 2014 | $1,555 | $38,080 | $6,580 | $31,500 |
Source: Public Records
Map
Nearby Homes
- 405 Orchard Dr
- 406 Orchard Hill Dr
- 245 Main St
- 38875 Old State Route 344
- 275 Walnut St
- 200 E Main St
- 955 W Main St
- 909 Lisbon Rd
- 375 Pearl St
- 457 Cherry Fork Ave
- 38495 Old State Route 344
- 36700 Butcher Rd
- 39144 State Route 558
- 40330 Kelly Park Rd
- 3600 Leetonia Rd
- 780 Cunningham Rd
- 3753 Grafton Rd
- 859 Cunningham Rd
- 405 Cunningham Rd
- 393 Cunningham Rd
- 446 Sleepy Hollow Dr
- 436 Sleepy Hollow Dr
- 424 Sleepy Hollow Dr
- 441 Sleepy Hollow Dr
- 435 Sleepy Hollow Dr
- 418 Sleepy Hollow Dr
- 423 Sleepy Hollow Dr
- 450 Honey Ln
- 417 Sleepy Hollow Dr
- 446 Honey Ln
- 436 Honey Ln
- 38740 Butcher Rd
- 405 Sleepy Hollow Dr
- 424 Honey Ln
- 394 Sleepy Hollow Dr
- 418 Honey Ln
- 393 Sleepy Hollow Dr
- 388 Sleepy Hollow Dr
- 406 Honey Ln
- 387 Sleepy Hollow Dr