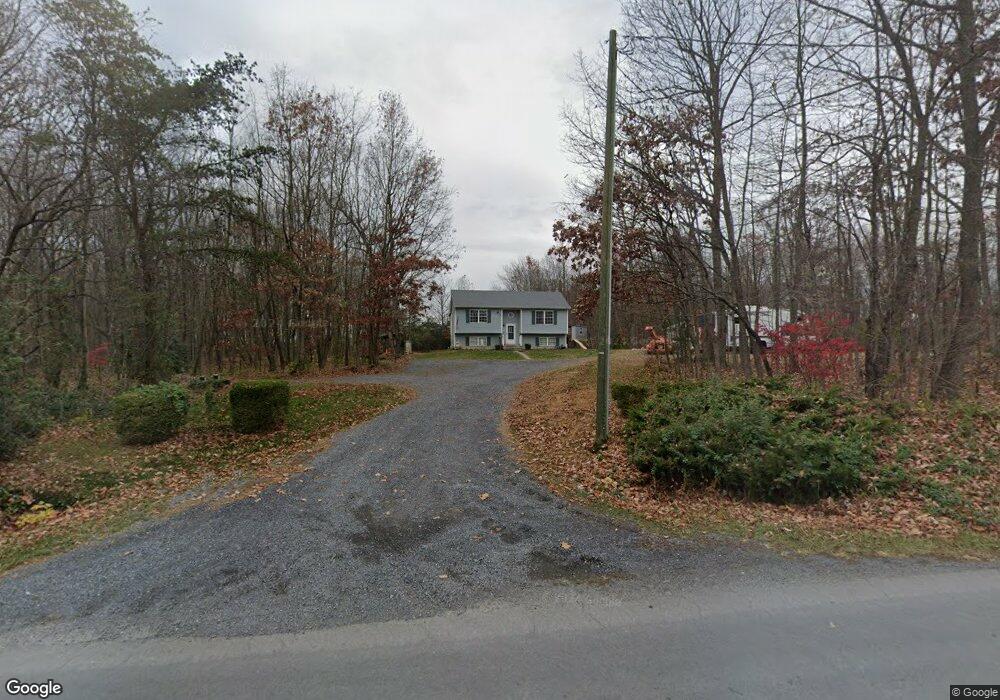
450 Stoneburner Rd Edinburg, VA 22824
Estimated Value: $285,000 - $412,000
3
Beds
2
Baths
1,700
Sq Ft
$206/Sq Ft
Est. Value
About This Home
This home is located at 450 Stoneburner Rd, Edinburg, VA 22824 and is currently estimated at $349,882, approximately $205 per square foot. 450 Stoneburner Rd is a home located in Shenandoah County with nearby schools including W.W. Robinson Elementary School, Peter Muhlenberg Middle School, and Central High School.
Ownership History
Date
Name
Owned For
Owner Type
Purchase Details
Closed on
Jan 28, 2021
Sold by
Tusing Abby L
Bought by
Tusing Abby L and Tusing Bradley A
Current Estimated Value
Home Financials for this Owner
Home Financials are based on the most recent Mortgage that was taken out on this home.
Original Mortgage
$165,000
Outstanding Balance
$121,213
Interest Rate
2.6%
Mortgage Type
New Conventional
Estimated Equity
$228,669
Purchase Details
Closed on
May 19, 2010
Sold by
Adkins Aluminum Inc
Bought by
Tusing Abby L
Home Financials for this Owner
Home Financials are based on the most recent Mortgage that was taken out on this home.
Original Mortgage
$189,448
Interest Rate
5.23%
Mortgage Type
FHA
Purchase Details
Closed on
Oct 9, 2009
Sold by
Plaugher Thomas D and Plaugher Mary E
Bought by
Deutsche Bank Trust Co
Create a Home Valuation Report for This Property
The Home Valuation Report is an in-depth analysis detailing your home's value as well as a comparison with similar homes in the area
Home Values in the Area
Average Home Value in this Area
Purchase History
| Date | Buyer | Sale Price | Title Company |
|---|---|---|---|
| Tusing Abby L | -- | None Available | |
| Tusing Abby L | $192,000 | Lawyers Title Insurance Corp | |
| Deutsche Bank Trust Co | $93,500 | None Available | |
| Adkins Aluminium Inc | $120,000 | Commonwealth Land Title | |
| Deutsche Bank Trust Company Americas | $93,500 | None Available |
Source: Public Records
Mortgage History
| Date | Status | Borrower | Loan Amount |
|---|---|---|---|
| Open | Tusing Abby L | $165,000 | |
| Previous Owner | Tusing Abby L | $189,448 |
Source: Public Records
Tax History Compared to Growth
Tax History
| Year | Tax Paid | Tax Assessment Tax Assessment Total Assessment is a certain percentage of the fair market value that is determined by local assessors to be the total taxable value of land and additions on the property. | Land | Improvement |
|---|---|---|---|---|
| 2025 | $1,386 | $216,500 | $55,300 | $161,200 |
| 2024 | $1,366 | $213,500 | $52,300 | $161,200 |
| 2023 | $1,281 | $213,500 | $52,300 | $161,200 |
| 2022 | $1,238 | $213,500 | $52,300 | $161,200 |
| 2021 | $1,020 | $147,800 | $43,300 | $104,500 |
| 2020 | $946 | $147,800 | $43,300 | $104,500 |
| 2019 | $946 | $147,800 | $43,300 | $104,500 |
| 2018 | $946 | $147,800 | $43,300 | $104,500 |
| 2017 | $887 | $147,800 | $43,300 | $104,500 |
| 2016 | $887 | $147,800 | $43,300 | $104,500 |
| 2015 | -- | $155,200 | $55,000 | $100,200 |
| 2014 | -- | $155,200 | $55,000 | $100,200 |
Source: Public Records
Map
Nearby Homes
- 3665 Stoney Creek Rd
- 4227 Stoney Creek Rd
- 721 Readus Rd
- 0 Wesley Chapel Lot 15 Dr
- 22286 Senedo Rd
- 2784 Ridge Hollow Rd
- 0 Three Mile Bank Ln
- 2891 Back Rd
- Lot 3 - Three Mile Bank Ln
- 1982 Barbershop Rd
- 3659 S Ox Rd
- 0 S Ox Rd Unit VASH2011792
- 758 Honeysuckle Ave
- 893 Lantz Rd
- 0 Stoney Creek Rd Unit VASH2011688
- 126 Chickadee Ct
- 111 Chickadee Ct
- 124 Kadies Ln
- 208 Kadies Ln
- 224 Kadies Ln
- 453 Stoneburner Rd
- 431 Stoneburner Rd
- 471 Stoneburner Rd
- 0 Tbd Stoneburner Rd
- 411 Stoneburner Rd
- 302 Stoneburner Rd
- 26 Elizabeth Ln
- 67 Grover Rd
- 50 Grover Rd
- 527 Stoneburner Rd
- 89 Grover Rd
- 56 Elizabeth Ln
- 300 Stoneburner Rd
- 72 Grover Rd
- 549 Stoneburner Rd
- 105 Grover Rd
- 74 Elizabeth Ln
- 88 Grover Rd
- 129 Grover Rd
- 92 Elizabeth Ln