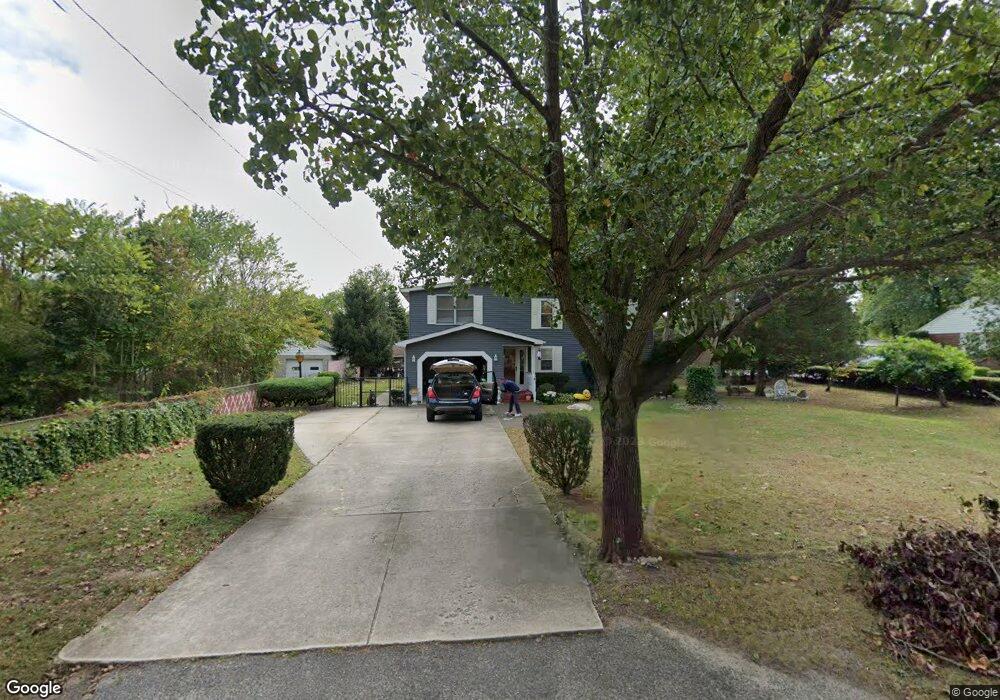
450 Walnut St Hammonton, NJ 08037
Estimated Value: $346,534 - $438,000
Studio
--
Bath
1,862
Sq Ft
$213/Sq Ft
Est. Value
About This Home
This home is located at 450 Walnut St, Hammonton, NJ 08037 and is currently estimated at $396,384, approximately $212 per square foot. 450 Walnut St is a home located in Atlantic County with nearby schools including Hammonton Early Childhood Education Center, Warren E. Sooy Jr. Elementary School, and Hammonton Middle School.
Ownership History
Date
Name
Owned For
Owner Type
Purchase Details
Closed on
Apr 3, 2008
Sold by
Ciraolo Joseph L and Ciraolo Lisa M
Bought by
Ciraolo Joseph L and Ciraolo Lisa M
Current Estimated Value
Home Financials for this Owner
Home Financials are based on the most recent Mortgage that was taken out on this home.
Original Mortgage
$128,311
Interest Rate
5.91%
Mortgage Type
New Conventional
Create a Home Valuation Report for This Property
The Home Valuation Report is an in-depth analysis detailing your home's value as well as a comparison with similar homes in the area
Home Values in the Area
Average Home Value in this Area
Purchase History
| Date | Buyer | Sale Price | Title Company |
|---|---|---|---|
| Ciraolo Joseph L | -- | None Available |
Source: Public Records
Mortgage History
| Date | Status | Borrower | Loan Amount |
|---|---|---|---|
| Closed | Ciraolo Joseph L | $128,311 |
Source: Public Records
Tax History
| Year | Tax Paid | Tax Assessment Tax Assessment Total Assessment is a certain percentage of the fair market value that is determined by local assessors to be the total taxable value of land and additions on the property. | Land | Improvement |
|---|---|---|---|---|
| 2025 | $5,650 | $214,400 | $58,000 | $156,400 |
| 2024 | $5,650 | $214,400 | $58,000 | $156,400 |
Source: Public Records
Map
Nearby Homes
- 40 Toni Lynn Ct
- 419 N Packard St
- 776 Fairview Ave
- 828 N Chew Rd
- 327 Pleasant St E
- 34 N Packard St
- 131 N 2nd St
- 26 N Packard St
- 10 N Packard St
- 118 Washington St N
- 131 W End Ave
- 120 Washington St N
- 127 W End Ave
- 125 W End Ave
- 114 Washington St N
- 123 W End Ave
- 116 Washington St N
- 112 Washington St N
- 121 W End Ave
- 119 W End Ave
Your Personal Tour Guide
Ask me questions while you tour the home.