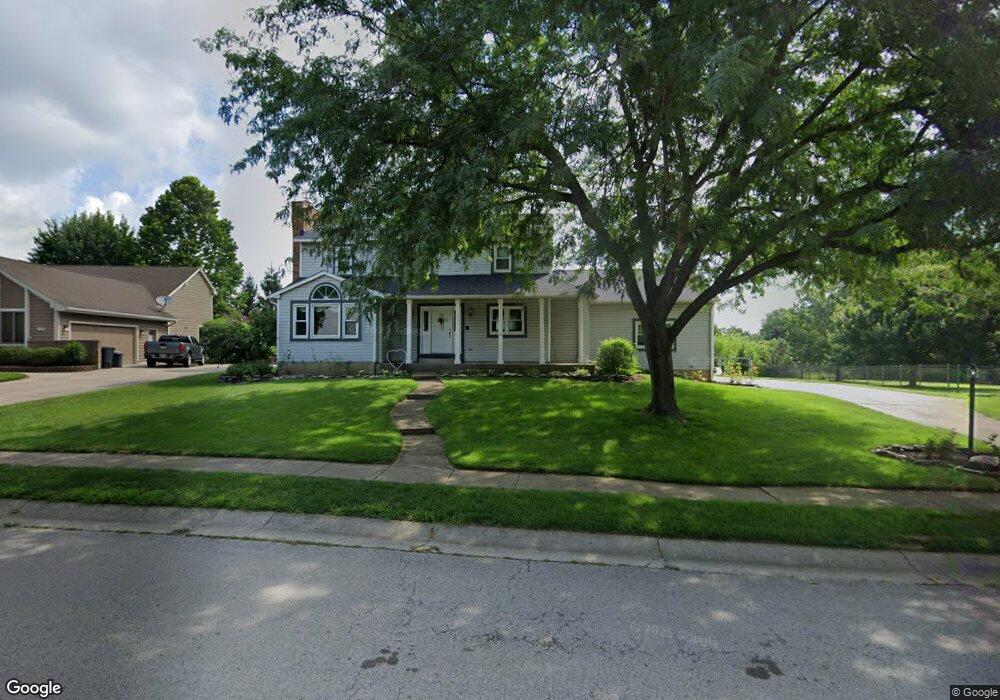
450 Wellington Way Springboro, OH 45066
Estimated Value: $412,756 - $437,000
4
Beds
3
Baths
2,208
Sq Ft
$193/Sq Ft
Est. Value
About This Home
This home is located at 450 Wellington Way, Springboro, OH 45066 and is currently estimated at $425,689, approximately $192 per square foot. 450 Wellington Way is a home located in Warren County with nearby schools including Clearcreek Elementary School, Springboro Intermediate School, and Dennis Elementary School.
Ownership History
Date
Name
Owned For
Owner Type
Purchase Details
Closed on
Mar 5, 2003
Sold by
Slominski Walter
Bought by
Vulgamore Donald J and Vulgamore Trisha B
Current Estimated Value
Home Financials for this Owner
Home Financials are based on the most recent Mortgage that was taken out on this home.
Original Mortgage
$155,000
Outstanding Balance
$67,218
Interest Rate
6%
Mortgage Type
New Conventional
Estimated Equity
$358,471
Purchase Details
Closed on
Oct 30, 1987
Sold by
Stanley Kolb and Stanley E.
Bought by
Slominski Slominski and Slominski Walter A
Purchase Details
Closed on
Apr 27, 1987
Sold by
Tyra Larry E and Tyra Beverly
Bought by
Kolb and Kolb Stanley E
Purchase Details
Closed on
Nov 7, 1986
Sold by
Tri-Ohio Development Co
Bought by
Tyra Tyra and Tyra Larry E
Purchase Details
Closed on
May 20, 1986
Sold by
Tri-Ohio Development Co
Bought by
Tri-Ohio Development Co
Create a Home Valuation Report for This Property
The Home Valuation Report is an in-depth analysis detailing your home's value as well as a comparison with similar homes in the area
Home Values in the Area
Average Home Value in this Area
Purchase History
| Date | Buyer | Sale Price | Title Company |
|---|---|---|---|
| Vulgamore Donald J | $220,000 | -- | |
| Slominski Slominski | $28,000 | -- | |
| Kolb | $27,000 | -- | |
| Tyra Tyra | $26,500 | -- | |
| Tri-Ohio Development Co | -- | -- |
Source: Public Records
Mortgage History
| Date | Status | Borrower | Loan Amount |
|---|---|---|---|
| Open | Vulgamore Donald J | $155,000 |
Source: Public Records
Tax History Compared to Growth
Tax History
| Year | Tax Paid | Tax Assessment Tax Assessment Total Assessment is a certain percentage of the fair market value that is determined by local assessors to be the total taxable value of land and additions on the property. | Land | Improvement |
|---|---|---|---|---|
| 2024 | $4,347 | $111,310 | $31,500 | $79,810 |
| 2023 | $3,685 | $86,527 | $16,940 | $69,587 |
| 2022 | $3,630 | $86,527 | $16,940 | $69,587 |
| 2021 | $3,379 | $86,527 | $16,940 | $69,587 |
| 2020 | $3,194 | $71,509 | $14,000 | $57,509 |
| 2019 | $2,945 | $71,509 | $14,000 | $57,509 |
| 2018 | $2,947 | $71,509 | $14,000 | $57,509 |
| 2017 | $2,817 | $61,576 | $12,250 | $49,326 |
| 2016 | $2,938 | $61,576 | $12,250 | $49,326 |
| 2015 | $2,945 | $61,576 | $12,250 | $49,326 |
| 2014 | $2,905 | $57,550 | $11,450 | $46,100 |
| 2013 | $2,903 | $70,370 | $14,000 | $56,370 |
Source: Public Records
Map
Nearby Homes
- 450 Evergreen Dr
- 375 Tamarack Trail
- 510 Royal Springs Dr
- 120 Bramblebush Ln
- 180 Teakwood Ln
- 420 Clearcreek Franklin Rd
- 145 Cedar Hill Ln
- 120 Clearview Dr
- 23 Pheasant Run Cir Unit 9A
- 20 Terradyne Trace
- 150 Tanglewood Dr
- 15 Belvoir Ct
- 1785 Archerfield Place
- 510 Thomas Dr
- 10987 Ayer Place
- 5561 Sagewood Dr
- 473 Mccray Blvd
- 145 Redbud Dr
- 65 Milford Ct
- The McPherson Plan at Wadestone - Designer Collection
- 460 Wellington Way
- 440 Wellington Way
- 131 Queen Ann Ct
- 139 Queen Ann Ct
- 455 Wellington Way
- 445 Wellington Way
- 470 Wellington Way
- 465 Wellington Way
- 430 Wellington Way
- 371 Saint James Place
- 123 Queen Ann Ct
- 387 Saint James Place
- 142 Queen Ann Ct
- 355 Saint James Place
- 420 Wellington Way
- 460 Evergreen Dr
- 435 Wellington Way
- 355 St James Place
- 440 Evergreen Dr
- 117 Queen Ann Ct