J
Landlord's Agent in 2025
James Strelec
TexCen Realty
(512) 626-0405
3 Total Sales
Estimated Value: $417,000 - $552,060
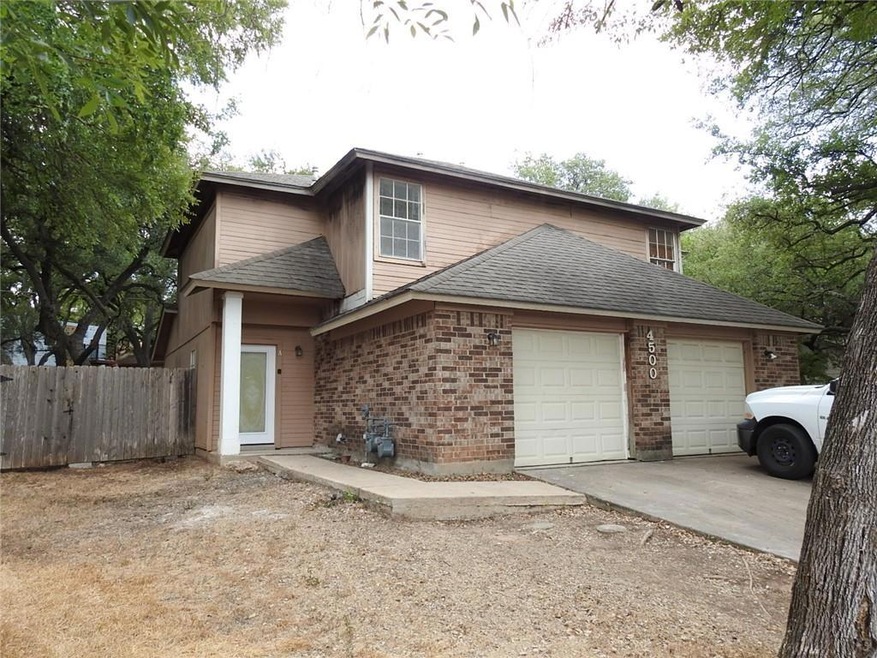
Rare opportunity! Spacious 2/1.5 two story townhome layout in a cul-de-sac. Beautiful, shady area with lots of trees! HUGE fenced back yard! Kitchen has real wood cabinetry and large walk in pantry! Fridge included! Walk in closets, ceiling fans in bedrooms! Washer/Dryer connection and attached garage! OWNER PAYS WATER! Easy access to 183 or Mopac and only minutes from tons of shopping and entertainment at The Domain! Renters insurance required. Tenant will be responsible for $20/mo air filter program (see app guidelines). $150 admin fee due with the deposit upon lease approval. All co-applicants must complete their apps before the application is considered complete and ready to process. FAST & EASY APPLICATION PROCESS!!!
Last Agent to Rent the Property
TexCen Realty Brokerage Phone: (512) 292-0800 License #0592144 Listed on: 12/13/2024
Last Renter's Agent
Adrienne Buckingham
Pure Realty License #0795065

| Date | Event | Price | List to Sale | Price per Sq Ft |
|---|---|---|---|---|
| 03/01/2025 03/01/25 | Rented | $1,495 | 0.0% | -- |
| 02/25/2025 02/25/25 | Under Contract | -- | -- | -- |
| 02/17/2025 02/17/25 | Price Changed | $1,495 | -6.3% | $2 / Sq Ft |
| 02/04/2025 02/04/25 | Price Changed | $1,595 | -3.3% | $2 / Sq Ft |
| 01/09/2025 01/09/25 | Price Changed | $1,650 | -5.7% | $2 / Sq Ft |
| 12/13/2024 12/13/24 | For Rent | $1,750 | +3.2% | -- |
| 12/07/2023 12/07/23 | Rented | $1,695 | 0.0% | -- |
| 12/04/2023 12/04/23 | Under Contract | -- | -- | -- |
| 11/04/2023 11/04/23 | Price Changed | $1,695 | -3.1% | $2 / Sq Ft |
| 10/27/2023 10/27/23 | Price Changed | $1,750 | -2.5% | $2 / Sq Ft |
| 10/11/2023 10/11/23 | Price Changed | $1,795 | -3.0% | $2 / Sq Ft |
| 09/28/2023 09/28/23 | For Rent | $1,850 | +5.7% | -- |
| 09/23/2022 09/23/22 | Rented | $1,750 | 0.0% | -- |
| 09/15/2022 09/15/22 | Under Contract | -- | -- | -- |
| 09/06/2022 09/06/22 | Price Changed | $1,750 | -5.4% | $2 / Sq Ft |
| 08/22/2022 08/22/22 | For Rent | $1,850 | +60.9% | -- |
| 07/18/2017 07/18/17 | Rented | $1,150 | +5.0% | -- |
| 07/18/2017 07/18/17 | Under Contract | -- | -- | -- |
| 05/02/2017 05/02/17 | For Rent | $1,095 | 0.0% | -- |
| 05/26/2016 05/26/16 | Rented | $1,095 | 0.0% | -- |
| 05/05/2016 05/05/16 | Under Contract | -- | -- | -- |
| 04/28/2016 04/28/16 | For Rent | $1,095 | -- | -- |
| Year | Tax Paid | Tax Assessment Tax Assessment Total Assessment is a certain percentage of the fair market value that is determined by local assessors to be the total taxable value of land and additions on the property. | Land | Improvement |
|---|---|---|---|---|
| 2025 | $10,050 | $488,772 | $277,159 | $211,613 |
| 2023 | $10,050 | $422,589 | $150,000 | $272,589 |
| 2022 | $8,426 | $426,661 | $150,000 | $276,661 |
| 2021 | $8,093 | $371,800 | $150,000 | $221,800 |
| 2020 | $7,078 | $330,000 | $150,000 | $180,000 |
| 2018 | $3,701 | $167,177 | $40,000 | $127,177 |
| 2017 | $3,728 | $167,177 | $40,000 | $127,177 |
| 2016 | $3,728 | $167,177 | $40,000 | $127,177 |
| 2015 | $3,978 | $191,402 | $40,000 | $151,402 |
| 2014 | $3,978 | $167,177 | $40,000 | $127,177 |
J
Landlord's Agent in 2025
James Strelec
TexCen Realty
(512) 626-0405
3 Total Sales
A
Tenant's Agent in 2025
Adrienne Buckingham
Pure Realty
C
Buyer's Agent in 2023
Christian Haile
eXp Realty, LLC
(832) 785-9117
8 Total Sales
Buyer's Agent in 2022
Sandy Joseph
Berkshire Hathaway TX Realty
(512) 965-8662
79 Total Sales
K
Seller's Agent in 2017
Kyle Mozingo
TexCen Realty
(512) 547-7353
A
Buyer's Agent in 2017
Aaron Wilson
Cityscape Property Group
(361) 218-7271
Source: Unlock MLS (Austin Board of REALTORS®)
MLS Number: 1804961
APN: 504507
Disclaimer: Certain information contained herein is derived from information provided by parties other than Homes.com. All information provided is deemed reliable, but is not guaranteed to be accurate and should be independently verified.
![]() Based on information from the Austin Board of REALTORS® (alternatively, from ACTRIS). Neither the Board nor ACTRIS guarantees or is in any way responsible for its accuracy. All data is provided “AS IS” and with all faults. Data maintained by the Board or ACTRIS may not reflect all real estate activity in the market.
Based on information from the Austin Board of REALTORS® (alternatively, from ACTRIS). Neither the Board nor ACTRIS guarantees or is in any way responsible for its accuracy. All data is provided “AS IS” and with all faults. Data maintained by the Board or ACTRIS may not reflect all real estate activity in the market.
Information being provided is for consumers’ personal, non-commercial use and may not be used for any purpose other than to identify prospective properties consumers may be interested in purchasing.
The Digital Millennium Copyright Act of 1998, 17 U.S.C. § 512 (the “DMCA”) provides recourse for copyright owners who believe that material appearing on the Internet infringes their rights under U.S. copyright law. If you believe in good faith that any content or material made available in connection with our website or services infringes your copyright, you (or your agent) may send us a notice requesting that the content or material be removed, or access to it blocked.
Notices must be sent in writing by email to DMCAnotice@MLSGrid.com.
The DMCA requires that your notice of alleged copyright infringement include the following information:
(1) description of the copyrighted work that is the subject of claimed infringement;
(2) description of the alleged infringing content and information sufficient to permit us to locate the content;
(3) contact information for you, including your address, telephone number and email address;
(4) a statement by you that you have a good faith belief that the content in the manner complained of is not authorized by the copyright owner, or its agent, or by the operation of any law;
(5) a statement by you, signed under penalty of perjury, that the information in the notification is accurate and that you have the authority to enforce the copyrights that are claimed to be infringed; and
(6) a physical or electronic signature of the copyright owner or a person authorized to act on the copyright owner’s behalf. Failure to include all of the above information may result in the delay of the processing of your complaint.