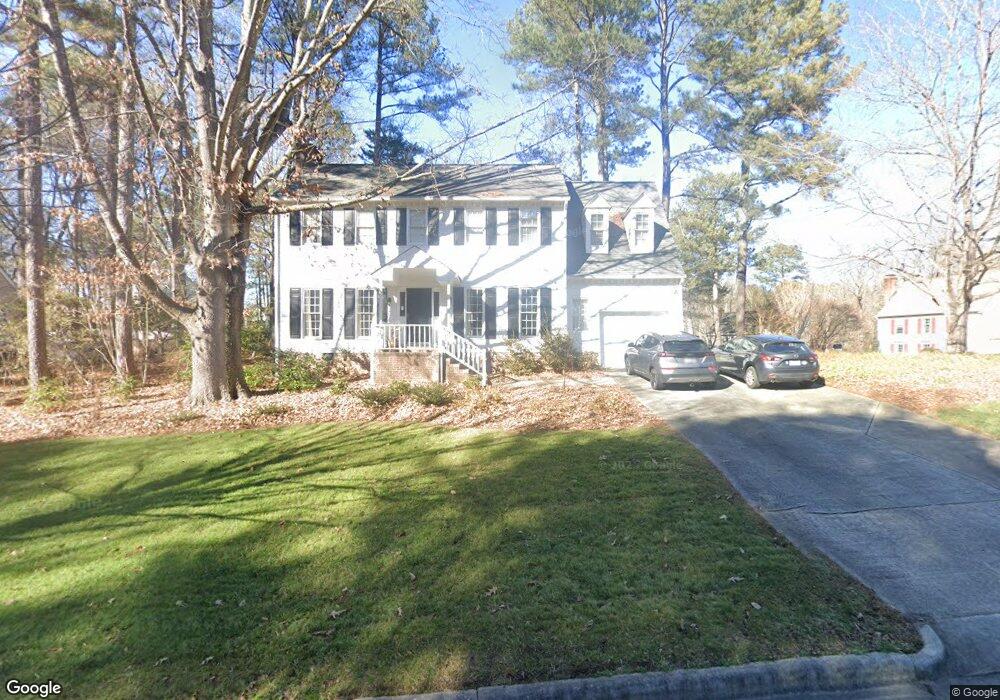
4500 Highgate Dr Durham, NC 27713
Woodcroft NeighborhoodEstimated Value: $535,723 - $556,000
About This Home
This home is located at 4500 Highgate Dr, Durham, NC 27713 and is currently estimated at $541,931, approximately $240 per square foot. 4500 Highgate Dr is a home located in Durham County with nearby schools including Southwest Elementary School, Morehead Montessori, and Sherwood Githens Middle.
Ownership History
We collect this data history from publicly available records. To have your information removed, we recommend requesting removal directly through your county’s website.
Purchase Details
Home Financials for this Owner
Home Financials are based on the most recent Mortgage that was taken out on this home.Purchase Details
Home Financials for this Owner
Home Financials are based on the most recent Mortgage that was taken out on this home.Purchase Details
Home Financials for this Owner
Home Financials are based on the most recent Mortgage that was taken out on this home.Home Values in the Area
Average Home Value in this Area
Purchase History
We collect this data history from publicly available records. To have your information removed, we recommend requesting removal directly through your county’s website.
| Date | Buyer | Sale Price | Title Company |
|---|---|---|---|
| -- | Boston National Title | ||
| $242,000 | None Available | ||
| $190,000 | -- |
Mortgage History
We collect this data history from publicly available records. To have your information removed, we recommend requesting removal directly through your county’s website.
| Date | Status | Borrower | Loan Amount |
|---|---|---|---|
| Open | $181,000 | ||
| Closed | $217,800 | ||
| Previous Owner | $180,405 |
Tax History
We collect this data history from publicly available records. To have your information removed, we recommend requesting removal directly through your county’s website.
| Year | Tax Paid | Tax Assessment Tax Assessment Total Assessment is a certain percentage of the fair market value that is determined by local assessors to be the total taxable value of land and additions on the property. | Land | Improvement |
|---|---|---|---|---|
| 2025 | $5,244 | $529,025 | $150,400 | $378,625 |
| 2024 | $4,003 | $286,983 | $60,847 | $226,136 |
| 2023 | $3,759 | $286,983 | $60,847 | $226,136 |
| 2022 | $3,673 | $286,983 | $60,847 | $226,136 |
| 2021 | $3,656 | $286,983 | $60,847 | $226,136 |
| 2020 | $3,570 | $286,983 | $60,847 | $226,136 |
| 2019 | $3,570 | $286,983 | $60,847 | $226,136 |
| 2018 | $3,359 | $247,633 | $44,835 | $202,798 |
| 2017 | $3,334 | $247,633 | $44,835 | $202,798 |
| 2016 | $3,222 | $247,633 | $44,835 | $202,798 |
| 2015 | $3,347 | $241,768 | $46,086 | $195,682 |
| 2014 | $3,347 | $241,768 | $46,086 | $195,682 |
Map
- 18 Strawberry Ridge Ln
- 102 Shady Spring Place
- 1 Autumn Woods Dr
- 6 Aurora Ct
- 138 Timber Ridge Dr
- 9 Lansgate Ct
- 610 Cross Timbers Dr
- 3704 Chimney Ridge Place Unit 207
- 21 Thorne Ridge Dr
- 500 W Woodcroft Pkwy Unit 8a
- 500 W Woodcroft Pkwy Unit 2c
- 3706 Chimney Ridge Place Unit 108
- 3803 Chimney Ridge Place Unit 4
- 124 Legacy Ln
- 3805 Chimney Ridge Place Unit 106
- 4 Applewood Square
- 22 Preakness Dr
- 200 W Woodcroft Pkwy Unit 52 B
- 200 W Woodcroft Pkwy Unit 57a
- 15 Preakness Dr
- 5 Sanderling Ct
- 4506 Highgate Dr
- 11 Sanderling Ct
- 4501 Highgate Dr
- 2 Sanderling Ct
- 4425 Highgate Dr
- 4507 Highgate Dr
- 4 Sanderling Ct
- 4510 Highgate Dr
- 15 Sanderling Ct
- 6 Sanderling Ct
- 4511 Highgate Dr
- 8 Sanderling Ct
- 4514 Highgate Dr
- 17 Sanderling Ct
- 12 Sanderling Ct
- 4515 Highgate Dr
- 4416 Highgate Dr
- 4500 Rollingwood Dr
- 4506 Rollingwood Dr
Ask me questions while you tour the home.