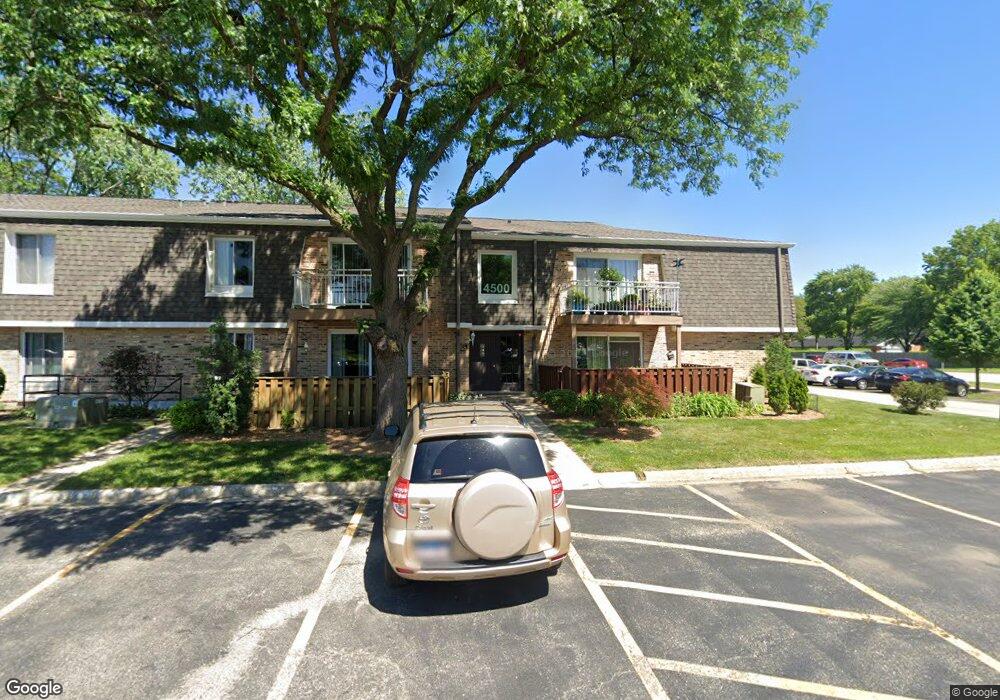
4500 Kings Walk Dr Unit 45001 Rolling Meadows, IL 60008
Plum Grove Village NeighborhoodEstimated Value: $161,000 - $182,000
1
Bed
--
Bath
700
Sq Ft
$242/Sq Ft
Est. Value
About This Home
This home is located at 4500 Kings Walk Dr Unit 45001, Rolling Meadows, IL 60008 and is currently estimated at $169,515, approximately $242 per square foot. 4500 Kings Walk Dr Unit 45001 is a home located in Cook County with nearby schools including Central Road Elementary School, William Fremd High School, and Galesburg High School.
Ownership History
Date
Name
Owned For
Owner Type
Purchase Details
Closed on
Jul 11, 2007
Sold by
Gerald Chuck W
Bought by
Miezio Barbara
Current Estimated Value
Home Financials for this Owner
Home Financials are based on the most recent Mortgage that was taken out on this home.
Original Mortgage
$90,750
Outstanding Balance
$57,487
Interest Rate
6.76%
Mortgage Type
Purchase Money Mortgage
Estimated Equity
$112,028
Purchase Details
Closed on
Jun 28, 2004
Sold by
Blizzard Gloria
Bought by
Gerald Chuck W
Home Financials for this Owner
Home Financials are based on the most recent Mortgage that was taken out on this home.
Original Mortgage
$94,400
Interest Rate
6.39%
Mortgage Type
Purchase Money Mortgage
Purchase Details
Closed on
Oct 9, 1995
Sold by
American National Bk & Tr Co Of Chicago
Bought by
Blizzard Gloria
Home Financials for this Owner
Home Financials are based on the most recent Mortgage that was taken out on this home.
Original Mortgage
$61,260
Interest Rate
7.8%
Create a Home Valuation Report for This Property
The Home Valuation Report is an in-depth analysis detailing your home's value as well as a comparison with similar homes in the area
Home Values in the Area
Average Home Value in this Area
Purchase History
| Date | Buyer | Sale Price | Title Company |
|---|---|---|---|
| Miezio Barbara | $121,000 | Cst | |
| Gerald Chuck W | $118,000 | Rtc | |
| Blizzard Gloria | $64,500 | -- |
Source: Public Records
Mortgage History
| Date | Status | Borrower | Loan Amount |
|---|---|---|---|
| Open | Miezio Barbara | $90,750 | |
| Previous Owner | Gerald Chuck W | $94,400 | |
| Previous Owner | Blizzard Gloria | $61,260 |
Source: Public Records
Tax History Compared to Growth
Tax History
| Year | Tax Paid | Tax Assessment Tax Assessment Total Assessment is a certain percentage of the fair market value that is determined by local assessors to be the total taxable value of land and additions on the property. | Land | Improvement |
|---|---|---|---|---|
| 2024 | $1,691 | $11,325 | $1,715 | $9,610 |
| 2023 | $1,571 | $11,325 | $1,715 | $9,610 |
| 2022 | $1,571 | $11,325 | $1,715 | $9,610 |
| 2021 | $478 | $8,059 | $857 | $7,202 |
| 2020 | $1,668 | $8,059 | $857 | $7,202 |
| 2019 | $1,667 | $8,943 | $857 | $8,086 |
| 2018 | $795 | $5,810 | $796 | $5,014 |
| 2017 | $798 | $5,810 | $796 | $5,014 |
| 2016 | $1,011 | $5,810 | $796 | $5,014 |
| 2015 | $1,177 | $6,230 | $735 | $5,495 |
| 2014 | $1,169 | $6,230 | $735 | $5,495 |
| 2013 | $1,121 | $6,230 | $735 | $5,495 |
Source: Public Records
Map
Nearby Homes
- 4512 Kings Walk Dr Unit 1D
- 4 Eton on Oxford
- 2 Croydon on Duxbury
- 4602 Euclid Ave Unit 2A
- 2041 Vermont St
- 4704 Euclid Ave Unit 1B
- 1808 Plum Grove Rd Unit 1B
- 4301 Euclid Ave
- 912 S Plum Grove Rd Unit 321
- 904 S Plum Grove Rd Unit 301
- 4941 Emerson Ave
- 805 S Benton St
- 36 W Fern Ct Unit 117B
- 3 E Orchard Ln
- 160 E Forest Ln
- 2600 Brookwood Way Dr Unit 316
- 2600 Brookwood Way Dr Unit 305
- 2600 Brookwood Way Dr Unit 214
- 2600 Brookwood Unit 314
- 2600 Brookwood Way Dr Unit 212
- 4500 Kings Walk Dr Unit 45002
- 4500 Kings Walk Dr Unit 45002
- 4500 Kings Walk Dr Unit 45001
- 4500 Kings Walk Dr Unit 45001
- 4500 Kings Walk Dr Unit 45002
- 4500 Kings Walk Dr Unit 45002
- 4500 Kings Walk Dr Unit 45001
- 4500 Kings Walk Dr Unit 2A
- 4500 Kings Walk Dr Unit 1A
- 4500 Kings Walk Dr Unit 1D
- 4500 Kings Walk Dr Unit 1B
- 4506 Kings Walk Dr Unit 1A
- 4506 Kings Walk Dr Unit 45062
- 4506 Kings Walk Dr Unit 45062
- 4506 Kings Walk Dr Unit 45061
- 4506 Kings Walk Dr Unit 45061
- 4506 Kings Walk Dr Unit 45061
- 4506 Kings Walk Dr Unit 45062
- 4506 Kings Walk Dr Unit 45061
- 4506 Kings Walk Dr Unit 45062