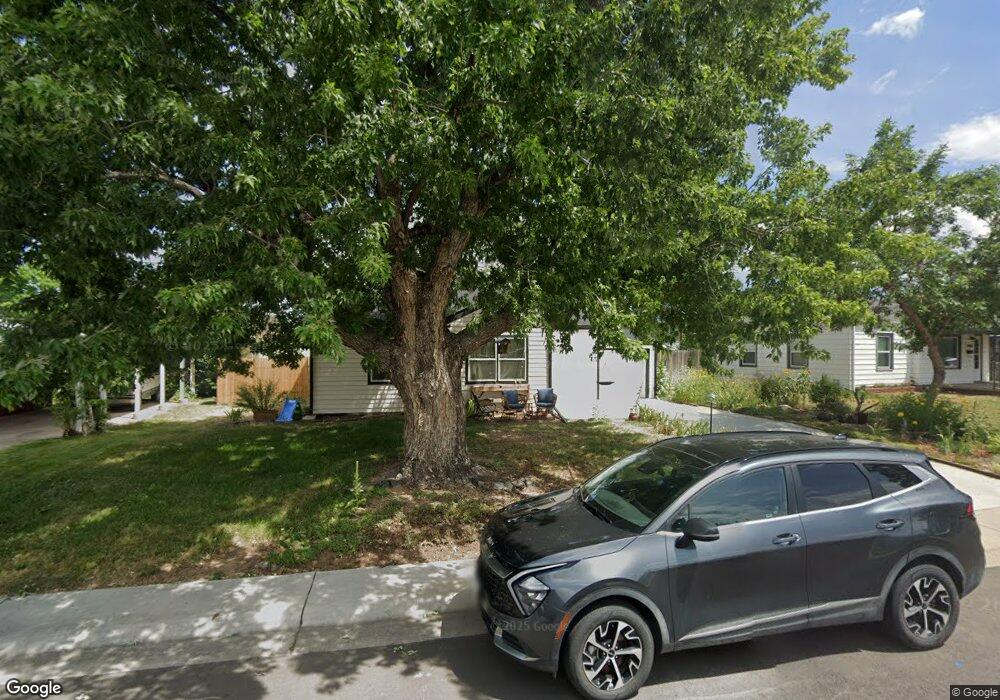
4500 Quivas St Denver, CO 80211
Sunnyside NeighborhoodEstimated Value: $469,656 - $537,000
2
Beds
1
Bath
737
Sq Ft
$670/Sq Ft
Est. Value
About This Home
This home is located at 4500 Quivas St, Denver, CO 80211 and is currently estimated at $493,914, approximately $670 per square foot. 4500 Quivas St is a home located in Denver County with nearby schools including Bryant Webster Dual Language School, Denver Montessori Junior/Senior High School, and Skinner Middle School.
Ownership History
Date
Name
Owned For
Owner Type
Purchase Details
Closed on
Sep 4, 2020
Sold by
Nalar Llc
Bought by
Garcia Marika Madrid
Current Estimated Value
Home Financials for this Owner
Home Financials are based on the most recent Mortgage that was taken out on this home.
Original Mortgage
$399,000
Outstanding Balance
$354,086
Interest Rate
2.9%
Mortgage Type
New Conventional
Estimated Equity
$139,828
Purchase Details
Closed on
Jun 5, 2020
Sold by
Elevated Equity Llc
Bought by
Nalar Llc
Home Financials for this Owner
Home Financials are based on the most recent Mortgage that was taken out on this home.
Original Mortgage
$290,000
Interest Rate
12%
Mortgage Type
Commercial
Purchase Details
Closed on
Jun 2, 2020
Sold by
Duckworth Helen R
Bought by
Elevated Equity Llc
Home Financials for this Owner
Home Financials are based on the most recent Mortgage that was taken out on this home.
Original Mortgage
$290,000
Interest Rate
12%
Mortgage Type
Commercial
Create a Home Valuation Report for This Property
The Home Valuation Report is an in-depth analysis detailing your home's value as well as a comparison with similar homes in the area
Home Values in the Area
Average Home Value in this Area
Purchase History
| Date | Buyer | Sale Price | Title Company |
|---|---|---|---|
| Garcia Marika Madrid | $420,000 | First Integrity Title | |
| Nalar Llc | $289,500 | First Integrity Title | |
| Elevated Equity Llc | $280,000 | First Integrity Title |
Source: Public Records
Mortgage History
| Date | Status | Borrower | Loan Amount |
|---|---|---|---|
| Open | Garcia Marika Madrid | $399,000 | |
| Previous Owner | Nalar Llc | $290,000 |
Source: Public Records
Tax History Compared to Growth
Tax History
| Year | Tax Paid | Tax Assessment Tax Assessment Total Assessment is a certain percentage of the fair market value that is determined by local assessors to be the total taxable value of land and additions on the property. | Land | Improvement |
|---|---|---|---|---|
| 2024 | $2,641 | $33,340 | $14,280 | $19,060 |
| 2023 | $2,583 | $33,340 | $14,280 | $19,060 |
| 2022 | $2,348 | $29,520 | $18,640 | $10,880 |
| 2021 | $2,348 | $24,930 | $19,180 | $5,750 |
| 2020 | $1,119 | $22,230 | $19,180 | $3,050 |
| 2019 | $1,088 | $22,230 | $19,180 | $3,050 |
| 2018 | $872 | $18,470 | $16,900 | $1,570 |
| 2017 | $869 | $18,470 | $16,900 | $1,570 |
| 2016 | $630 | $15,460 | $10,674 | $4,786 |
| 2015 | $604 | $15,460 | $10,674 | $4,786 |
| 2014 | $507 | $12,200 | $6,408 | $5,792 |
Source: Public Records
Map
Nearby Homes
- 4528 Quivas St
- 1731 W Chaffee Place
- 1828 W 46th Ave
- 4545 Raritan St
- 4335 Osage St
- 4322 Quivas St
- 1931 W 46th Ave Unit 12
- 4390 Osage St
- 4314 Pecos St
- 4455 Tejon St
- 1827 W 47th Ave
- 1901 W 47th Ave
- 1953 W 47th Ave
- 4590 Vallejo St
- 4342 Umatilla St
- 4233 Shoshone St
- 1921 W Elk Place Unit 2
- 4435 Vallejo St
- 4131 Quivas St
- 4227 Mariposa St