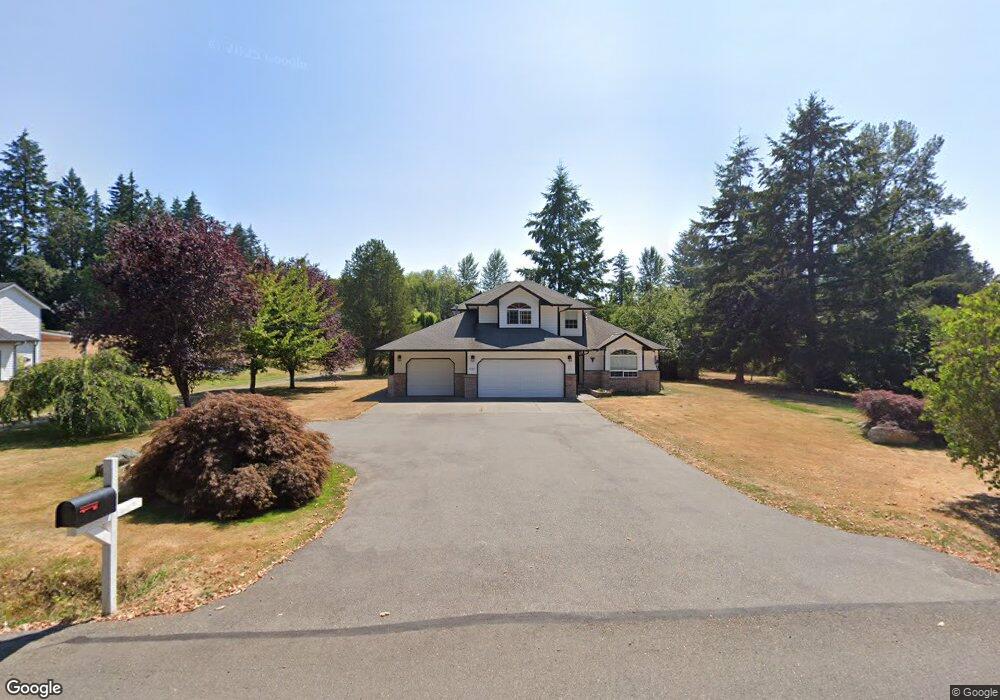
4500 SE Foss Rd Port Orchard, WA 98366
Parkwood NeighborhoodEstimated Value: $601,000 - $666,000
3
Beds
3
Baths
1,913
Sq Ft
$333/Sq Ft
Est. Value
About This Home
This home is located at 4500 SE Foss Rd, Port Orchard, WA 98366 and is currently estimated at $636,125, approximately $332 per square foot. 4500 SE Foss Rd is a home located in Kitsap County with nearby schools including Orchard Heights Elementary School, Marcus Whitman Middle School, and South Kitsap High School.
Ownership History
Date
Name
Owned For
Owner Type
Purchase Details
Closed on
Jul 30, 2009
Sold by
Wells Fargo Bank Na
Bought by
Cosper Richard W and Cosper Kelli M
Current Estimated Value
Home Financials for this Owner
Home Financials are based on the most recent Mortgage that was taken out on this home.
Original Mortgage
$305,858
Outstanding Balance
$198,197
Interest Rate
5.09%
Mortgage Type
FHA
Estimated Equity
$437,928
Purchase Details
Closed on
Feb 13, 2009
Sold by
Matson Rita
Bought by
Wells Fargo Bank Na
Create a Home Valuation Report for This Property
The Home Valuation Report is an in-depth analysis detailing your home's value as well as a comparison with similar homes in the area
Home Values in the Area
Average Home Value in this Area
Purchase History
| Date | Buyer | Sale Price | Title Company |
|---|---|---|---|
| Cosper Richard W | $311,782 | First American Title Ins | |
| Wells Fargo Bank Na | $234,256 | First American Title Ins |
Source: Public Records
Mortgage History
| Date | Status | Borrower | Loan Amount |
|---|---|---|---|
| Open | Cosper Richard W | $305,858 |
Source: Public Records
Tax History Compared to Growth
Tax History
| Year | Tax Paid | Tax Assessment Tax Assessment Total Assessment is a certain percentage of the fair market value that is determined by local assessors to be the total taxable value of land and additions on the property. | Land | Improvement |
|---|---|---|---|---|
| 2026 | $5,129 | $588,080 | $109,600 | $478,480 |
| 2025 | $5,129 | $588,080 | $109,600 | $478,480 |
| 2024 | $4,973 | $588,080 | $109,600 | $478,480 |
| 2023 | $4,941 | $588,080 | $109,600 | $478,480 |
| 2022 | $4,767 | $475,150 | $87,840 | $387,310 |
| 2021 | $4,581 | $431,890 | $83,660 | $348,230 |
| 2020 | $4,095 | $374,100 | $71,090 | $303,010 |
| 2019 | $3,540 | $354,810 | $67,050 | $287,760 |
| 2018 | $3,731 | $307,920 | $82,350 | $225,570 |
| 2017 | $3,381 | $307,920 | $82,350 | $225,570 |
| 2016 | $3,346 | $278,800 | $82,350 | $196,450 |
| 2015 | $3,242 | $273,660 | $82,350 | $191,310 |
| 2014 | -- | $270,240 | $82,350 | $187,890 |
| 2013 | -- | $267,610 | $86,690 | $180,920 |
Source: Public Records
Map
Nearby Homes
- 1400 Baby Doll Rd SE
- 4258 SE Woodford Ct
- 824 Cherub Place E
- 4010 SE Lovell St
- 1200 Baby Doll Rd E
- 1560 Woodridge Dr SE
- 3930 SE Mile Hill Dr
- 3900 SE Mile Hill Dr
- 3884 Madrona Dr SE
- 1242 Lidstrom Rd E
- 740 Tufts Ave E
- 1135 Hillandale Dr E
- 1663 Harrison Ave SE
- 71 Carson Ave SE
- 4898 E Collins Rd
- 0 Wendell Ave SE
- 5101 SE Natchez Ct
- 2169 Ponderosa Dr SE
- 2014 Kelowna Place SE
- 803 Collins Creek Ln E
- 4546 SE Foss Rd
- 4484 SE Foss Rd
- 4563 SE Foss Rd
- 4460 SE Horstman Rd
- 4464 SE Horstman Rd
- 4564 SE Horstman Rd
- 4579 SE Foss Rd
- 4651 SE Foss Rd
- 4468 SE Horstman Rd
- 4489 SE Horstman Rd
- 4669 SE Foss Rd
- 4503 SE Horstman Rd
- 4553 SE Horstman Rd
- 4516 SE Foss Rd
- 4610 SE Horstman Rd
- 4449 SE Horstman Rd
- 4710 SE Foss Rd
- 4571 SE Horstman Rd