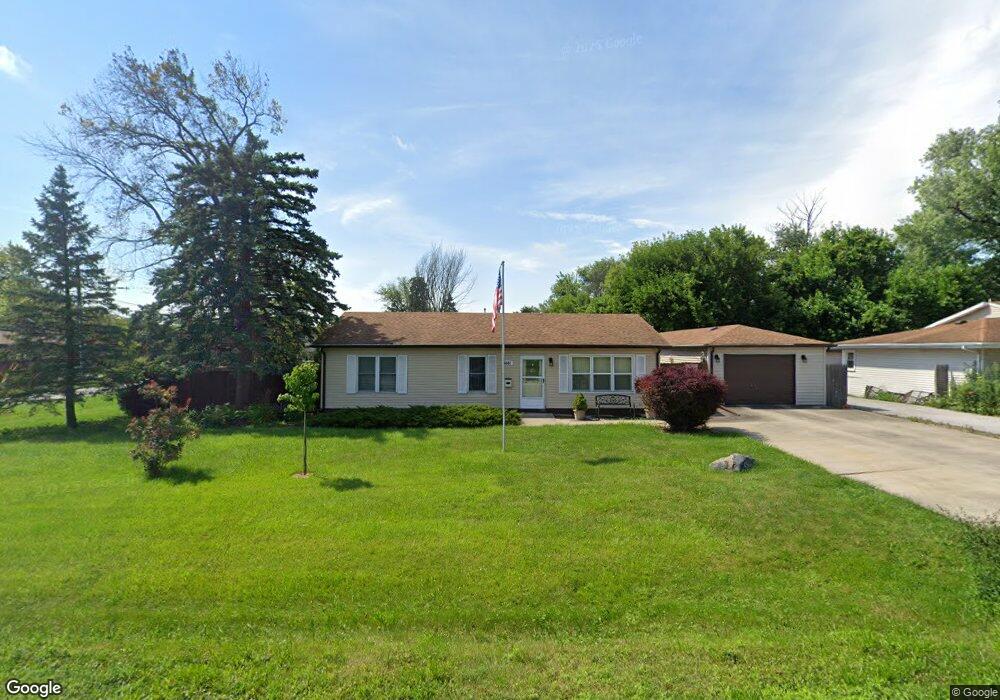
4501 151st St Midlothian, IL 60445
Estimated Value: $225,688 - $262,000
3
Beds
1
Bath
1,092
Sq Ft
$222/Sq Ft
Est. Value
About This Home
This home is located at 4501 151st St, Midlothian, IL 60445 and is currently estimated at $242,672, approximately $222 per square foot. 4501 151st St is a home located in Cook County with nearby schools including Lee R Foster Elementary School, Jack Hille Middle School, and Oak Forest High School.
Ownership History
Date
Name
Owned For
Owner Type
Purchase Details
Closed on
Jul 17, 2007
Sold by
Everett Richard C and Everett Vicky L
Bought by
Blakeman Paul A
Current Estimated Value
Home Financials for this Owner
Home Financials are based on the most recent Mortgage that was taken out on this home.
Original Mortgage
$85,000
Outstanding Balance
$52,957
Interest Rate
6.71%
Mortgage Type
Unknown
Estimated Equity
$189,715
Purchase Details
Closed on
Nov 11, 1998
Sold by
Bare Kevin D and Bare Nancy M
Bought by
Everett Richard C and Everett Vicky L
Home Financials for this Owner
Home Financials are based on the most recent Mortgage that was taken out on this home.
Original Mortgage
$105,000
Interest Rate
12%
Create a Home Valuation Report for This Property
The Home Valuation Report is an in-depth analysis detailing your home's value as well as a comparison with similar homes in the area
Home Values in the Area
Average Home Value in this Area
Purchase History
| Date | Buyer | Sale Price | Title Company |
|---|---|---|---|
| Blakeman Paul A | $175,000 | Ticor Title | |
| Everett Richard C | $137,000 | Professional National Title |
Source: Public Records
Mortgage History
| Date | Status | Borrower | Loan Amount |
|---|---|---|---|
| Open | Blakeman Paul A | $85,000 | |
| Previous Owner | Everett Richard C | $105,000 |
Source: Public Records
Tax History
| Year | Tax Paid | Tax Assessment Tax Assessment Total Assessment is a certain percentage of the fair market value that is determined by local assessors to be the total taxable value of land and additions on the property. | Land | Improvement |
|---|---|---|---|---|
| 2025 | $4,550 | $16,000 | $3,500 | $12,500 |
| 2024 | $4,550 | $16,000 | $3,500 | $12,500 |
| 2023 | $3,852 | $16,000 | $3,500 | $12,500 |
| 2022 | $3,852 | $11,727 | $3,000 | $8,727 |
| 2021 | $3,784 | $11,726 | $3,000 | $8,726 |
| 2020 | $3,725 | $11,726 | $3,000 | $8,726 |
| 2019 | $4,342 | $13,404 | $2,750 | $10,654 |
| 2018 | $4,253 | $13,404 | $2,750 | $10,654 |
| 2017 | $4,146 | $13,404 | $2,750 | $10,654 |
| 2016 | $3,805 | $11,377 | $2,500 | $8,877 |
| 2015 | $3,666 | $11,377 | $2,500 | $8,877 |
| 2014 | $3,579 | $11,377 | $2,500 | $8,877 |
| 2013 | $3,421 | $12,096 | $2,500 | $9,596 |
Source: Public Records
Map
Nearby Homes
- 14927 Kenton Ave
- 15213 Waverly Ave
- 15505 Cicero Ave Unit 3D
- 14632 Kostner Ave
- 4010 150th St Unit 10
- 14837 Karlov Ave
- 14903 Terrace Ln
- 14970 Pulaski Rd Unit 5
- 14545 Kostner Ave
- 14913 Sheila Ct
- 14540 Kolin Ave
- 15527 Lamon Ave
- 14528 Kolin Ave
- 15035 Harding Ave
- 4031 147th St
- 14506 Knox Ave
- 14448 Kilbourne Ave
- 15115 Springfield Ave
- 15346 Le Claire Ave
- 14618 Keystone Ave
- 4521 151st St
- 15104 Kilbourne Ave
- 4463 151st St
- 15050 Kilbourne Ave
- 15116 Kilbourne Ave
- 15105 Kilbourne Ave
- 4529 151st St
- 15043 Kilbourne Ave
- 15120 Kilbourne Ave
- 4524 151st St
- 4455 151st St
- 15040 Kilbourne Ave
- 15049 Kilbourne Ave
- 15124 Kilbourne Ave
- 4528 151st St
- 4531 151st St
- 15107 Kilbourne Ave
- 4451 151st St
- 15111 Kilbourne Ave
- 15037 Kilbourne Ave
Your Personal Tour Guide
Ask me questions while you tour the home.