4501 E 3rd St Bloomington, IN 47401
3
Beds
--
Bath
1,400
Sq Ft
293,594
Sq Ft Lot
About This Home
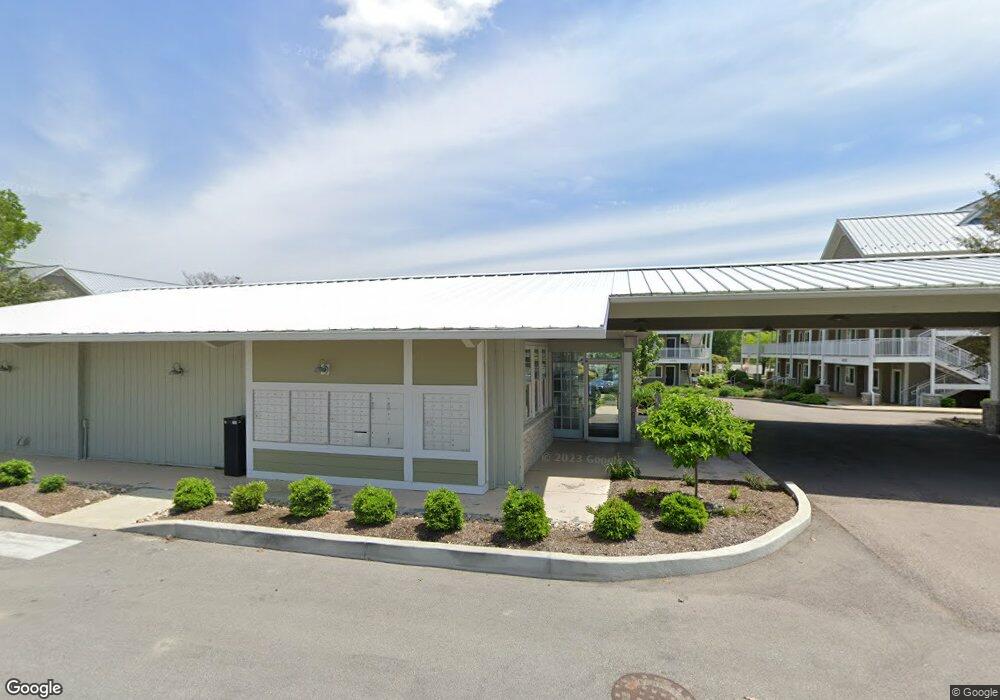
**We offer virtual tours!** SummerHouse features 1 and 2-bedroom flats and lofts inspired by modern Midwest cottage design. We've made it easy by including all utilities and offering furnished and unfurnished apartments to choose from. Most of our floorplans include vinyl plank or wood laminate flooring, as well as updated appliances and fixtures.
Create a Home Valuation Report for This Property
The Home Valuation Report is an in-depth analysis detailing your home's value as well as a comparison with similar homes in the area
Property History
| Date | Event | Price | List to Sale | Price per Sq Ft |
|---|---|---|---|---|
| 12/04/2025 12/04/25 | Off Market | $1,149 | -- | -- |
| 11/11/2025 11/11/25 | Price Changed | $1,149 | -32.4% | $2 / Sq Ft |
| 10/07/2025 10/07/25 | Price Changed | $1,699 | +13.3% | $3 / Sq Ft |
| 08/25/2025 08/25/25 | Price Changed | $1,499 | +25.0% | $3 / Sq Ft |
| 07/16/2025 07/16/25 | Price Changed | $1,199 | -20.0% | $2 / Sq Ft |
| 06/16/2025 06/16/25 | Price Changed | $1,499 | +46.2% | $3 / Sq Ft |
| 05/01/2025 05/01/25 | Price Changed | $1,025 | -10.8% | $2 / Sq Ft |
| 12/23/2024 12/23/24 | Price Changed | $1,149 | +2.7% | $2 / Sq Ft |
| 05/06/2024 05/06/24 | Price Changed | $1,119 | -34.1% | $2 / Sq Ft |
| 05/03/2024 05/03/24 | Price Changed | $1,699 | -6.4% | $3 / Sq Ft |
| 05/02/2024 05/02/24 | Price Changed | $1,815 | -10.4% | $4 / Sq Ft |
| 12/27/2023 12/27/23 | Price Changed | $2,025 | +32.8% | $4 / Sq Ft |
| 10/04/2023 10/04/23 | Price Changed | $1,525 | -23.6% | $3 / Sq Ft |
| 08/07/2023 08/07/23 | For Rent | $1,995 | 0.0% | -- |
| 07/13/2023 07/13/23 | For Rent | $1,995 | 0.0% | -- |
| 06/20/2023 06/20/23 | Price Changed | $1,995 | 0.0% | $4 / Sq Ft |
| 06/20/2023 06/20/23 | For Rent | $1,995 | +13.0% | -- |
| 05/02/2023 05/02/23 | Price Changed | $1,765 | +64.2% | $3 / Sq Ft |
| 02/02/2023 02/02/23 | Price Changed | $1,075 | -0.9% | $2 / Sq Ft |
| 12/29/2022 12/29/22 | Price Changed | $1,085 | -26.7% | $2 / Sq Ft |
| 12/06/2022 12/06/22 | Price Changed | $1,480 | -25.6% | $3 / Sq Ft |
| 06/07/2022 06/07/22 | For Rent | $1,990 | 0.0% | -- |
| 05/18/2022 05/18/22 | For Rent | $1,990 | -- | -- |
Tax History
| Year | Tax Paid | Tax Assessment Tax Assessment Total Assessment is a certain percentage of the fair market value that is determined by local assessors to be the total taxable value of land and additions on the property. | Land | Improvement |
|---|---|---|---|---|
| 2025 | $381,787 | $22,816,600 | $4,239,500 | $18,577,100 |
| 2024 | $381,787 | $18,608,300 | $4,239,500 | $14,368,800 |
| 2023 | $161,843 | $15,257,400 | $1,179,500 | $14,077,900 |
| 2022 | $319,494 | $15,749,400 | $1,179,500 | $14,569,900 |
| 2021 | $311,153 | $14,981,000 | $1,179,500 | $13,801,500 |
| 2020 | $306,230 | $14,843,300 | $1,179,500 | $13,663,800 |
| 2019 | $312,546 | $14,864,200 | $1,179,500 | $13,684,700 |
| 2018 | $251,557 | $11,937,000 | $1,179,500 | $10,757,500 |
| 2017 | $134,859 | $6,368,900 | $1,179,500 | $5,189,400 |
| 2016 | $132,664 | $6,386,300 | $1,179,500 | $5,206,800 |
| 2014 | $26,638 | $1,280,100 | $1,179,500 | $100,600 |
Source: Public Records
Map
Nearby Homes
- 4602 E Falls Creek Dr
- 4021 E Morningside Dr
- 121 S Smith Rd
- 4019 E Bennington Blvd
- 273 S Roaring Fork Dr
- 4550 E Heritage Woods Rd
- xxxx Rd
- 4317 E Wembley Ct
- 4313 E Chadwick Ct
- 775 - 777 N Smith Rd
- 3621 E Post Rd
- 1006 S Carleton Ct
- 3615 E Post Rd
- 4314 E Stephens Dr
- 3522 E Grandview Dr
- 1375 & 1405 S Smith Rd
- 633 S Ravencrest Ave
- 4920 E Ridgewood Dr
- 4514 E Compton Blvd
- 1106 S Graywell Dr
- 4501 E 3rd St
- 119 S Park Ridge Rd
- 125 S Park Ridge Rd
- 4500 E 3rd St
- 134 N Park Ridge Rd
- 136 N Park Ridge Rd
- 116 S Park Ridge Rd
- 120 S Park Ridge Rd
- 4400 E Elouise Ave
- 110 S Park Ridge Rd
- 140 N Park Ridge Rd
- 138 N Park Ridge Rd
- 4506 E 3rd St
- 144 N Park Ridge Rd
- 100 S Park Ridge Rd
- 146 N Park Ridge Rd
- 365 S Park Ridge Rd
- 365 S Park Ridge Rd Unit 102
- 365 S Park Ridge Rd Unit 103
- 365 S Park Ridge Rd Unit 1
Your Personal Tour Guide
Ask me questions while you tour the home.