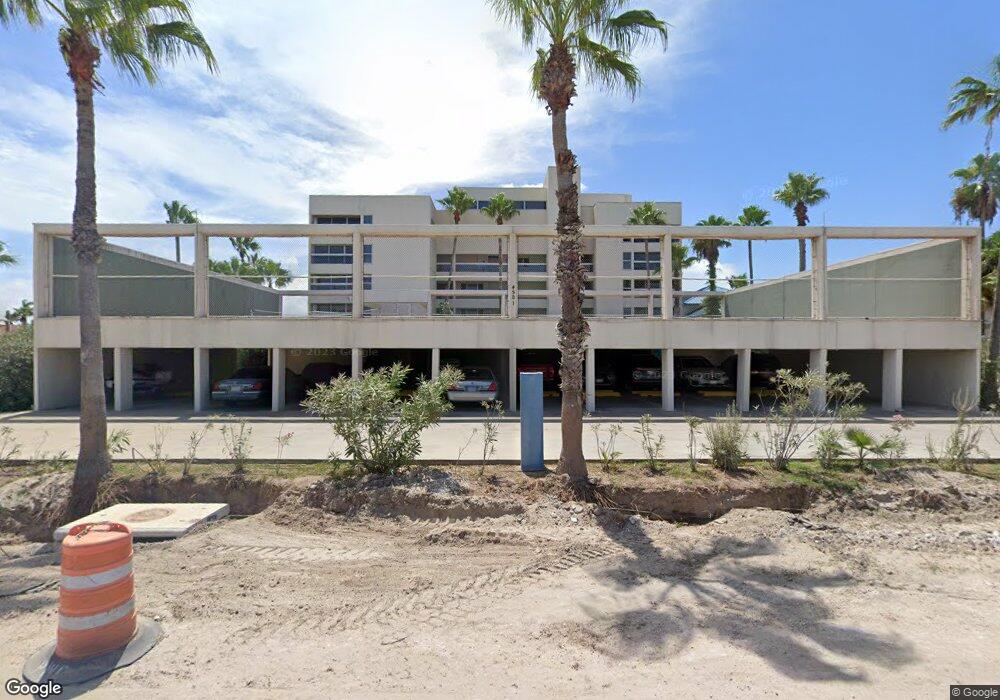
4501 Laguna Dr Unit 301 South Padre Island, TX 78597
Estimated Value: $493,429 - $759,000
3
Beds
3
Baths
1,644
Sq Ft
$353/Sq Ft
Est. Value
About This Home
This home is located at 4501 Laguna Dr Unit 301, South Padre Island, TX 78597 and is currently estimated at $580,107, approximately $352 per square foot. 4501 Laguna Dr Unit 301 is a home located in Cameron County with nearby schools including Garriga Elementary School, Derry Elementary School, and Port Isabel Junior High School.
Ownership History
Date
Name
Owned For
Owner Type
Purchase Details
Closed on
Oct 5, 2020
Sold by
Bass Gareli J C and Bass Rachell May
Bought by
Gulley Jonathan and Gulley Kindra
Current Estimated Value
Purchase Details
Closed on
Mar 23, 2020
Sold by
Seel Gregory R and Seel Michele Ruth
Bought by
Bass Garell J C and Bass Rachell May
Home Financials for this Owner
Home Financials are based on the most recent Mortgage that was taken out on this home.
Original Mortgage
$285,000
Interest Rate
3.4%
Mortgage Type
New Conventional
Purchase Details
Closed on
Jun 14, 2012
Sold by
Seel Gregory B and Seel Michele Ruth
Bought by
The Gregory Benjamin Seel And Michele Ru
Purchase Details
Closed on
Apr 27, 2011
Sold by
Johnson Orrin W and Johnson Patsy C
Bought by
Seel Gregory B and Seel Michele Ruth
Home Financials for this Owner
Home Financials are based on the most recent Mortgage that was taken out on this home.
Original Mortgage
$238,000
Interest Rate
4.82%
Create a Home Valuation Report for This Property
The Home Valuation Report is an in-depth analysis detailing your home's value as well as a comparison with similar homes in the area
Home Values in the Area
Average Home Value in this Area
Purchase History
| Date | Buyer | Sale Price | Title Company |
|---|---|---|---|
| Gulley Jonathan | -- | Edwards Abstract | |
| Bass Garell J C | -- | Rio Grande Valley Abstract C | |
| The Gregory Benjamin Seel And Michele Ru | -- | None Available | |
| Seel Gregory B | -- | None Available |
Source: Public Records
Mortgage History
| Date | Status | Borrower | Loan Amount |
|---|---|---|---|
| Previous Owner | Bass Garell J C | $285,000 | |
| Previous Owner | Seel Gregory B | $238,000 |
Source: Public Records
Tax History Compared to Growth
Tax History
| Year | Tax Paid | Tax Assessment Tax Assessment Total Assessment is a certain percentage of the fair market value that is determined by local assessors to be the total taxable value of land and additions on the property. | Land | Improvement |
|---|---|---|---|---|
| 2025 | $4,950 | $399,666 | -- | -- |
| 2024 | $4,950 | $363,333 | -- | -- |
| 2023 | $5,663 | $330,303 | $0 | $0 |
| 2022 | $5,690 | $300,275 | $49,912 | $250,363 |
| 2021 | $5,905 | $293,591 | $36,076 | $257,515 |
| 2020 | $6,017 | $297,168 | $36,076 | $261,092 |
| 2019 | $6,284 | $304,322 | $36,076 | $268,246 |
| 2018 | $5,837 | $282,862 | $36,076 | $246,786 |
| 2017 | $5,865 | $286,439 | $36,076 | $250,363 |
| 2016 | $6,011 | $293,591 | $36,076 | $257,515 |
| 2015 | $6,075 | $297,168 | $36,076 | $261,092 |
| 2014 | $6,075 | $304,322 | $0 | $0 |
Source: Public Records
Map
Nearby Homes
- 201 W Venus Ln Unit 6
- 4501 Laguna Blvd Unit 401
- 4501 Laguna Blvd Unit 201
- 107 W Mars Ln
- 205 W Saturn Ln
- 211 W Saturn Ln Unit B
- 907 W Saturn Ln W
- 200 W Esperanza St Unit 4
- 203 W Esperanza St
- 102 E Jupiter Ln Unit 3
- 200 W Constellation Dr Unit S401
- 200 W Constellation Dr Unit S402
- 217 W Hibiscus St
- 233-A W Esperanza St
- 112 E Venus Ln Unit 29
- 207 W Hibiscus St
- 201 W Hibiscus St
- 211 W Hibiscus St
- 105 E Constellation Dr Unit A
- TBD Padre Blvd
- 4501 Laguna Dr
- 4501 Laguna Dr
- 4501 Laguna Dr
- 4501 Laguna Dr Unit 304
- 4501 Laguna Dr Unit 303
- 4501 Laguna Dr Unit 302
- 4501 Laguna Dr Unit 205
- 4501 Laguna Dr Unit 204
- 4501 Laguna Dr Unit 203
- 4501 Laguna Dr Unit 202
- 4501 Laguna Dr Unit 201
- 4501 Laguna Dr Unit 106
- 4501 Laguna Dr Unit 105
- 4501 Laguna Dr
- 4501 Laguna Dr Unit 103
- 4501 Laguna Dr Unit 102
- 4501 Laguna Dr Unit 101
- 4501 Laguna Dr Unit 104
- 4501 Laguna Dr Unit 402
- 203 W Jupiter Ln