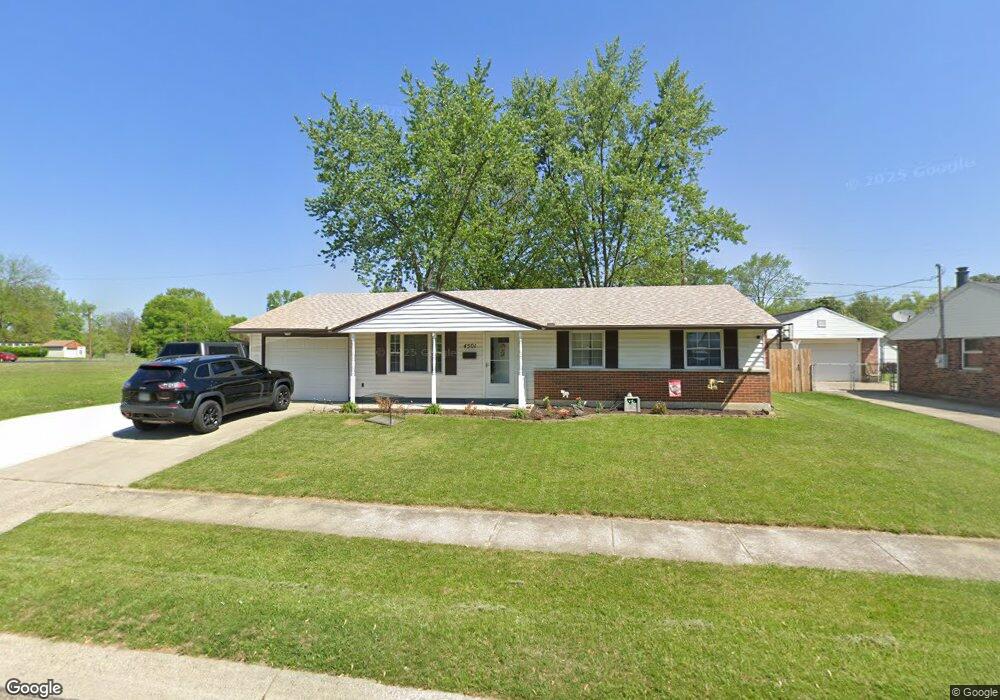
4501 Pennyston Ave Dayton, OH 45424
Estimated Value: $152,000 - $172,555
3
Beds
2
Baths
1,080
Sq Ft
$151/Sq Ft
Est. Value
About This Home
This home is located at 4501 Pennyston Ave, Dayton, OH 45424 and is currently estimated at $162,639, approximately $150 per square foot. 4501 Pennyston Ave is a home located in Montgomery County with nearby schools including Wayne High School and Pathway School of Discovery.
Ownership History
Date
Name
Owned For
Owner Type
Purchase Details
Closed on
Apr 10, 2018
Sold by
Deardorff John L and John L Deardorff Trust
Bought by
Hatfield Amber D
Current Estimated Value
Home Financials for this Owner
Home Financials are based on the most recent Mortgage that was taken out on this home.
Original Mortgage
$68,732
Outstanding Balance
$59,012
Interest Rate
4.37%
Mortgage Type
FHA
Estimated Equity
$103,627
Purchase Details
Closed on
Dec 10, 2008
Sold by
Nevin Carla L
Bought by
Household Realty Corporation
Purchase Details
Closed on
Nov 15, 2002
Sold by
Nevin Linda K
Bought by
Nevin Carla L
Home Financials for this Owner
Home Financials are based on the most recent Mortgage that was taken out on this home.
Original Mortgage
$72,800
Interest Rate
7.37%
Purchase Details
Closed on
Mar 19, 2001
Sold by
Singhal Raj P and Singhal Yog P
Bought by
Nevin Carla L and Nevin Linda K
Home Financials for this Owner
Home Financials are based on the most recent Mortgage that was taken out on this home.
Original Mortgage
$46,500
Interest Rate
6.99%
Create a Home Valuation Report for This Property
The Home Valuation Report is an in-depth analysis detailing your home's value as well as a comparison with similar homes in the area
Home Values in the Area
Average Home Value in this Area
Purchase History
| Date | Buyer | Sale Price | Title Company |
|---|---|---|---|
| Hatfield Amber D | $70,000 | None Available | |
| Household Realty Corporation | $52,000 | None Available | |
| Nevin Carla L | -- | -- | |
| Nevin Carla L | $76,500 | -- |
Source: Public Records
Mortgage History
| Date | Status | Borrower | Loan Amount |
|---|---|---|---|
| Open | Hatfield Amber D | $68,732 | |
| Previous Owner | Nevin Carla L | $72,800 | |
| Previous Owner | Nevin Carla L | $46,500 |
Source: Public Records
Tax History Compared to Growth
Tax History
| Year | Tax Paid | Tax Assessment Tax Assessment Total Assessment is a certain percentage of the fair market value that is determined by local assessors to be the total taxable value of land and additions on the property. | Land | Improvement |
|---|---|---|---|---|
| 2024 | $2,123 | $39,980 | $10,010 | $29,970 |
| 2023 | $2,123 | $39,980 | $10,010 | $29,970 |
| 2022 | $1,880 | $27,930 | $7,000 | $20,930 |
| 2021 | $1,910 | $27,930 | $7,000 | $20,930 |
| 2020 | $1,911 | $27,930 | $7,000 | $20,930 |
| 2019 | $2,284 | $29,650 | $7,000 | $22,650 |
| 2018 | $2,292 | $29,650 | $7,000 | $22,650 |
| 2017 | $2,278 | $29,650 | $7,000 | $22,650 |
| 2016 | $2,180 | $27,620 | $7,000 | $20,620 |
| 2015 | $2,152 | $27,620 | $7,000 | $20,620 |
| 2014 | $2,152 | $27,620 | $7,000 | $20,620 |
| 2012 | -- | $27,720 | $8,750 | $18,970 |
Source: Public Records
Map
Nearby Homes
- 5720 Old Troy Pike
- 4608 Nowak Ave
- 4407 Nowak Ave
- 5433 Pentland Cir
- 4470 Mahler Dr
- 4640 Wayne Meadows Cir
- 5660 Tomberg St
- 4646 Wayne Meadows Cir Unit 4640
- 4364 Leston Ave
- 5784 Pennywell Dr
- 5365 Mariner Dr
- 5669 Traymore Dr
- 4093 Vitek Dr Unit 4093
- 4440 Longfellow Ave
- 5560 Harshmanville Rd
- 5848 Tomberg St
- 4309 Kitridge Rd
- 4848 Rittenhouse Dr
- 5952 Tibet Dr
- 5059 Key West Dr
- 4511 Pennyston Ave
- 4500 Penhurst Place
- 4500 Pennyston Ave
- 4521 Pennyston Ave
- 4470 Pennyston Ave
- 4510 Pennyston Ave
- 4510 Penhurst Place
- 4460 Pennyston Ave
- 4520 Pennyston Ave
- 4531 Pennyston Ave
- 4520 Penhurst Place
- 4503 Penhurst Place
- 4407 Paletz Ct
- 4450 Pennyston Ave
- 4530 Pennyston Ave
- 4541 Pennyston Ave
- 4530 Penhurst Place
- 4509 Penhurst Place
- 4401 Paletz Ct
- 4413 Paletz Ct