Estimated payment $2,612/month
Highlights
- RV Parking in Community
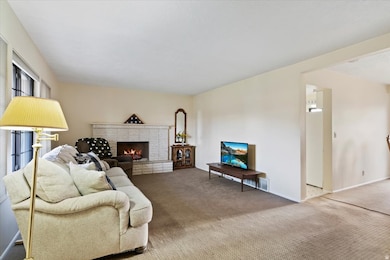
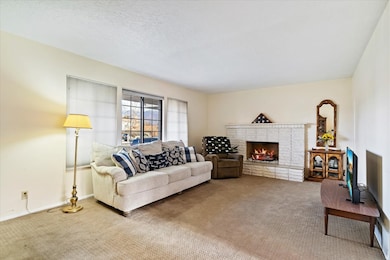
- 2 Fireplaces
- Cul-De-Sac
- Mountain View
- Community Pool
- Porch
About This Home
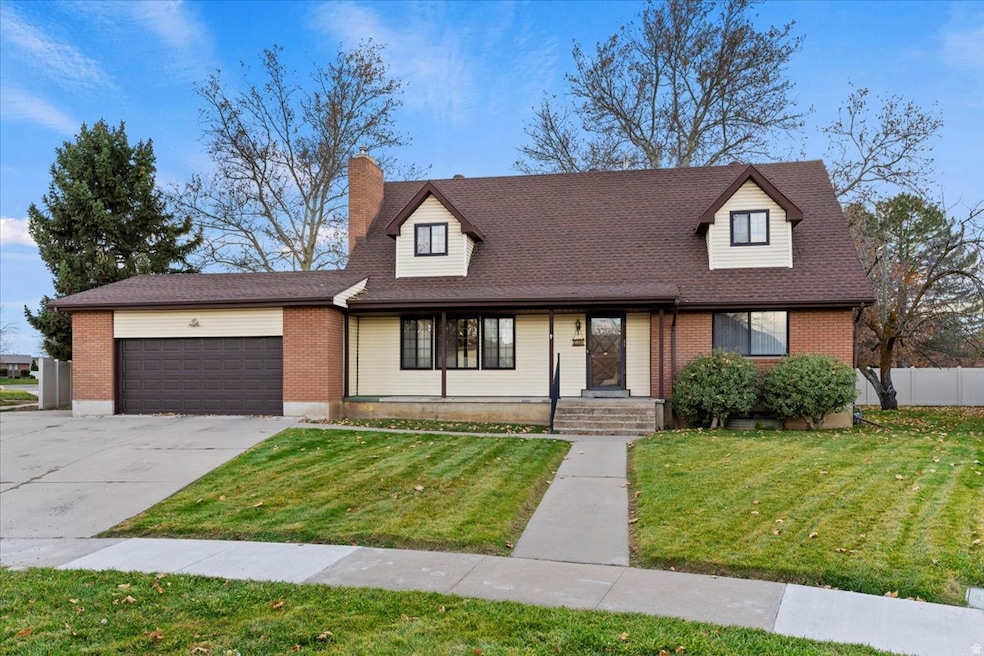
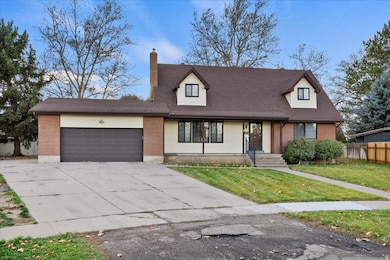
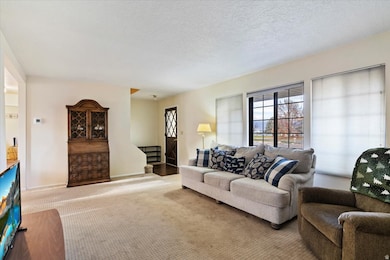
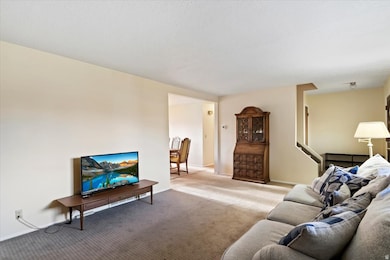
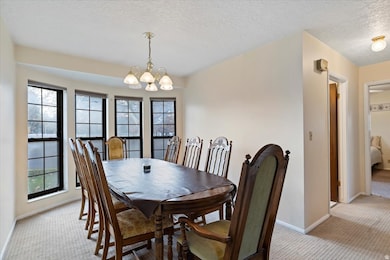
Located in a quiet cul-de-sac in the heart of Roy, this well-kept 5-bedroom, 2-bath home offers comfort, convenience, and stunning mountain views. The bright, open layout features spacious living areas, a functional kitchen, and plenty of natural light throughout. Upstairs bedrooms provide privacy and room to grow, while the main-level living spaces are perfect for gathering and everyday living. Outside, enjoy a fully fenced yard with space to play, garden, or entertain, all while taking in the scenic Wasatch Mountain views. A 2-car garage adds extra storage and convenience. Situated in the sought-after Herfordshire subdivision, this home offers a peaceful neighborhood feel with easy access to schools, parks, shopping, and Hill AFB.
Home Details
Home Type
- Single Family
Est. Annual Taxes
- $2,818
Year Built
- Built in 1973
Lot Details
- 10,019 Sq Ft Lot
- Cul-De-Sac
- Landscaped
- Property is zoned Single-Family
Parking
- 2 Car Attached Garage
- Open Parking
Home Design
- Brick Exterior Construction
Interior Spaces
- 2,749 Sq Ft Home
- 3-Story Property
- Dry Bar
- 2 Fireplaces
- Mountain Views
- Basement Fills Entire Space Under The House
- Free-Standing Range
Flooring
- Carpet
- Linoleum
Bedrooms and Bathrooms
- 5 Bedrooms | 2 Main Level Bedrooms
- 2 Full Bathrooms
Eco-Friendly Details
- Reclaimed Water Irrigation System
Outdoor Features
- Open Patio
- Porch
Schools
- Valley View Elementary School
- Sand Ridge Middle School
- Roy High School
Utilities
- Forced Air Heating and Cooling System
- Natural Gas Connected
Listing and Financial Details
- Assessor Parcel Number 08-129-0006
Community Details
Overview
- Property has a Home Owners Association
- RV Parking in Community
Amenities
- Community Barbecue Grill
- Picnic Area
Recreation
- Community Playground
- Community Pool
Map
Home Values in the Area
Average Home Value in this Area
Tax History
| Year | Tax Paid | Tax Assessment Tax Assessment Total Assessment is a certain percentage of the fair market value that is determined by local assessors to be the total taxable value of land and additions on the property. | Land | Improvement |
|---|---|---|---|---|
| 2025 | $2,818 | $449,160 | $155,000 | $294,160 |
| 2024 | $2,753 | $243,099 | $85,258 | $157,841 |
| 2023 | $2,707 | $239,800 | $82,387 | $157,413 |
| 2022 | $2,552 | $231,000 | $66,004 | $164,996 |
| 2021 | $2,210 | $330,000 | $85,012 | $244,988 |
| 2020 | $2,046 | $280,000 | $85,012 | $194,988 |
| 2019 | $2,028 | $262,000 | $49,940 | $212,060 |
| 2018 | $1,911 | $232,000 | $45,019 | $186,981 |
| 2017 | $1,765 | $200,000 | $45,019 | $154,981 |
| 2016 | $1,673 | $101,747 | $24,652 | $77,095 |
| 2015 | $1,537 | $95,469 | $21,944 | $73,525 |
| 2014 | $1,460 | $89,171 | $21,944 | $67,227 |
Property History
| Date | Event | Price | List to Sale | Price per Sq Ft |
|---|---|---|---|---|
| 11/21/2025 11/21/25 | For Sale | $450,000 | -- | $164 / Sq Ft |
Purchase History
| Date | Type | Sale Price | Title Company |
|---|---|---|---|
| Special Warranty Deed | -- | None Listed On Document | |
| Interfamily Deed Transfer | -- | First American Riverdale |
Source: UtahRealEstate.com
MLS Number: 2124097
APN: 08-129-0006
Disclaimer: Certain information contained herein is derived from information provided by parties other than Homes.com. All information provided is deemed reliable, but is not guaranteed to be accurate and should be independently verified.
![]() IDX information is provided exclusively for consumers’ personal, non-commercial use, that it may not be used for any purpose other than to identify prospective properties consumers may be interested in purchasing, and that the data is deemed reliable but is not guaranteed accurate by the MLS. Licensor is only providing the MLS Content and not other sources of data provided in the Product.
IDX information is provided exclusively for consumers’ personal, non-commercial use, that it may not be used for any purpose other than to identify prospective properties consumers may be interested in purchasing, and that the data is deemed reliable but is not guaranteed accurate by the MLS. Licensor is only providing the MLS Content and not other sources of data provided in the Product.
Based on information from the Wasatch Front Regional Multiple Listing Service, Inc.. All data, including all measurements and calculations of area, is obtained from various sources and has not been, and will not be, verified by broker or the MLS. All information should be independently reviewed and verified for accuracy. Properties may or may not be listed by the office/agent presenting the information.
- 4502 S 1720 W
- 4552 S 1675 W
- 1766 W 4575 S
- 1681 W 4450 S
- 4438 S 1700 W
- 4593 Promenade Dr
- 1825 W 4500 S Unit 101
- 4536 S 1900 W Unit 12
- 4602 Hathaway Dr
- 1825 W 4400 S
- 4642 S 1900 W Unit 41
- 4475 S 1975 W
- 2038 W 4600 S
- 2082 W 4450 S
- 1789 W 5000 S
- 5006 S 1800 W
- 2015 W 4225 S
- 1765 W 5000 S
- 2067 W 4750 S
- 1758 W 5025 S
- 4536 S 1900 W Unit 12
- 4499 S 1930 W
- 1801 W 4650 S
- 2225 W 4350 S
- 5000 S 1900 W
- 1551 W Riverdale Rd
- 4177 S 1000 W
- 2619 W 4650 S
- 2575 W 4800 S
- 4389 S Locomotive Dr
- 2602 W 4050 S
- 4621 S W Pk Dr
- 4345 S 700 W
- 2405 Hinckley Dr
- 2196 W 5600 S Unit A
- 5239 S 2700 W
- 557 Laker Way
- 2112 W 3300 S
- 4535 S Ridgeline Dr
- 4676 S Ridgeline Dr Unit 2
