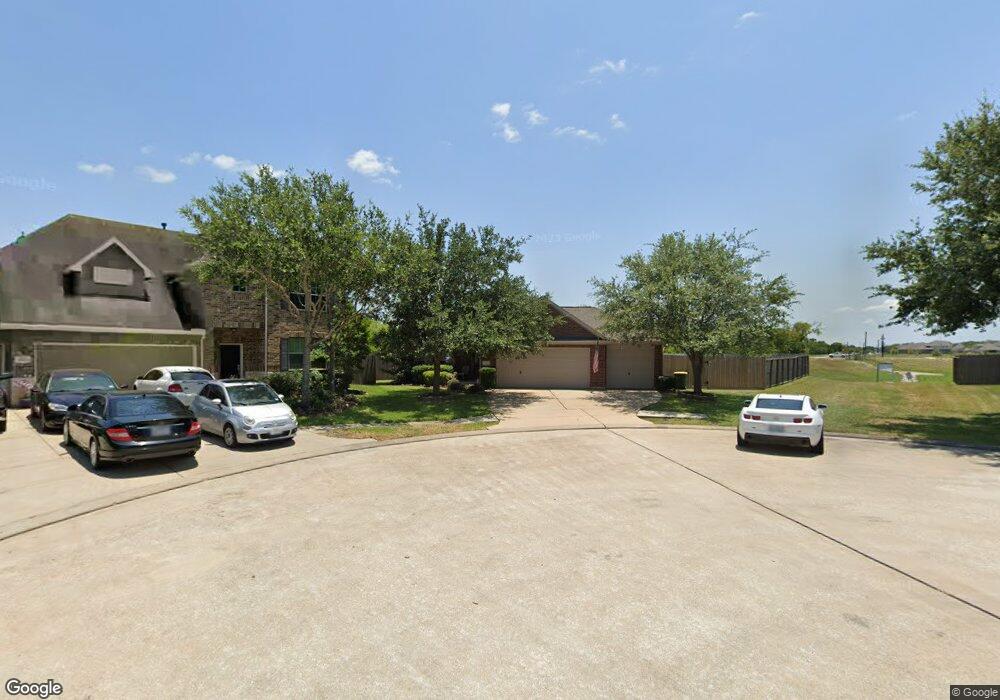
4502 Cedar Hill Dr Pearland, TX 77584
Estimated Value: $319,000 - $328,016
3
Beds
2
Baths
2,050
Sq Ft
$158/Sq Ft
Est. Value
About This Home
This home is located at 4502 Cedar Hill Dr, Pearland, TX 77584 and is currently estimated at $324,754, approximately $158 per square foot. 4502 Cedar Hill Dr is a home located in Brazoria County with nearby schools including C.J. Harris Elementary School, Pearland Junior High School East, and Alexander Middle School.
Ownership History
Date
Name
Owned For
Owner Type
Purchase Details
Closed on
Dec 21, 2015
Sold by
Fitzsimmons James Donald and Burns Christina Lynn
Bought by
Burns Bob
Current Estimated Value
Purchase Details
Closed on
Aug 31, 2009
Sold by
Lovell Matthew S and Lovell Kelly K
Bought by
Fitzsimmons Ii James Donald and Burns Christina Lynn
Home Financials for this Owner
Home Financials are based on the most recent Mortgage that was taken out on this home.
Original Mortgage
$150,590
Outstanding Balance
$98,785
Interest Rate
5.25%
Mortgage Type
FHA
Estimated Equity
$225,969
Purchase Details
Closed on
Mar 22, 2006
Sold by
Rah Of Texas Lp
Bought by
Lovell Matthew S and Johnson Kelly K
Home Financials for this Owner
Home Financials are based on the most recent Mortgage that was taken out on this home.
Original Mortgage
$141,594
Interest Rate
6.21%
Mortgage Type
Fannie Mae Freddie Mac
Create a Home Valuation Report for This Property
The Home Valuation Report is an in-depth analysis detailing your home's value as well as a comparison with similar homes in the area
Home Values in the Area
Average Home Value in this Area
Purchase History
| Date | Buyer | Sale Price | Title Company |
|---|---|---|---|
| Burns Bob | -- | South Land Title Llc | |
| Fitzsimmons Ii James Donald | -- | Stewart Title Company | |
| Lovell Matthew S | -- | First American Title |
Source: Public Records
Mortgage History
| Date | Status | Borrower | Loan Amount |
|---|---|---|---|
| Open | Fitzsimmons Ii James Donald | $150,590 | |
| Previous Owner | Lovell Matthew S | $141,594 |
Source: Public Records
Tax History Compared to Growth
Tax History
| Year | Tax Paid | Tax Assessment Tax Assessment Total Assessment is a certain percentage of the fair market value that is determined by local assessors to be the total taxable value of land and additions on the property. | Land | Improvement |
|---|---|---|---|---|
| 2025 | $7,518 | $317,910 | $28,060 | $289,850 |
| 2023 | $7,518 | $319,460 | $28,060 | $291,400 |
| 2022 | $7,257 | $268,240 | $28,060 | $240,180 |
| 2021 | $7,159 | $245,450 | $25,510 | $219,940 |
| 2020 | $6,968 | $227,850 | $25,510 | $202,340 |
| 2019 | $6,371 | $206,940 | $25,510 | $181,430 |
| 2018 | $6,112 | $199,300 | $25,510 | $173,790 |
| 2017 | $5,940 | $191,000 | $25,510 | $165,490 |
| 2016 | $5,936 | $190,860 | $25,510 | $165,350 |
| 2014 | $5,400 | $178,160 | $25,510 | $152,650 |
Source: Public Records
Map
Nearby Homes
- 4505 Cedar Hill Dr
- 2808 Tranquility Trail
- 4610 Meridian Park Dr
- 4304 Keystone Trail
- 4609 Buescher Ct
- 2913 Linda Dr
- 4805 Campbell Dr
- 2721 Village Mills Dr
- 2915 Veva Dr
- 4615 W Walnut St
- 3804 Lancer Cir
- 5003 Apple Springs Dr
- 2521 S Houston Ave
- 2515 S Houston Ave
- 2517 S Houston Ave
- 2519 S Houston Ave
- 5013 Camden Ln
- 2511 S Houston Ave
- 5109 Playa Dr
- Oliver Plan at Pearland Old Townsite
- 2823 Lost Maples Dr
- 4504 Cedar Hill Dr
- 2821 Lost Maples Dr
- 4506 Cedar Hill Dr
- 2819 Lost Maples Dr
- 4501 Cedar Hill Dr
- 4508 Cedar Hill Dr
- 4503 Cedar Hill Dr
- 2817 Lost Maples Dr
- 4510 Cedar Hill Dr
- 4502 Meridian Park Dr
- 2812 Tranquility Trail
- 2815 Lost Maples Dr
- 4504 Meridian Park Dr
- 2810 Tranquility Trail
- 4601 Cedar Hill Dr
- 4504 Meridian Park Dr
- 4602 Cedar Hill Dr
- 4506 Meridian Park Dr
- 4310 Summer Ln