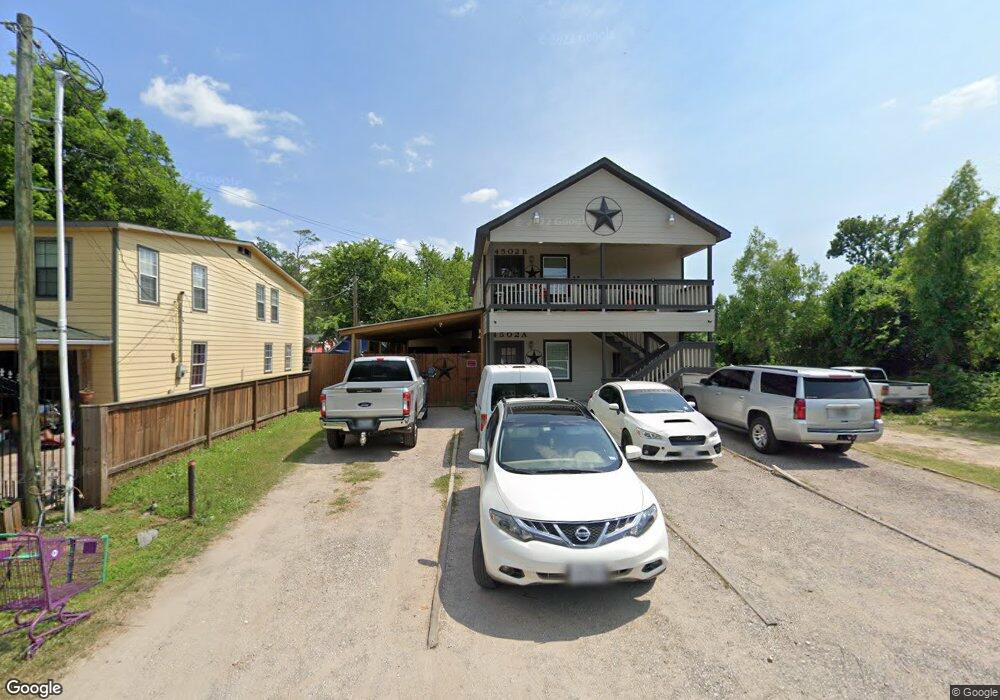
4502 Hanley Ln Houston, TX 77093
East Aldine NeighborhoodEstimated Value: $182,000 - $335,691
6
Beds
4
Baths
3,178
Sq Ft
$84/Sq Ft
Est. Value
About This Home
This home is located at 4502 Hanley Ln, Houston, TX 77093 and is currently estimated at $265,897, approximately $83 per square foot. 4502 Hanley Ln is a home located in Harris County with nearby schools including Escamilla Elementary School, Macarthur Ninth Grade School, and Hambrick Middle School.
Ownership History
Date
Name
Owned For
Owner Type
Purchase Details
Closed on
Aug 7, 2025
Sold by
Garcia Capital Investments Llc
Bought by
Garcia Erasmo and Garcia Imelda Gonzalez
Current Estimated Value
Purchase Details
Closed on
Mar 27, 2024
Sold by
Xela Group Inc
Bought by
Garcia Capital Investments Llc
Purchase Details
Closed on
May 7, 2022
Sold by
Erasmo Garcia
Bought by
Xela Group Inc
Purchase Details
Closed on
May 7, 2007
Sold by
Cantu Jesus and Cantu Beatriz A
Bought by
Garcia Erasmo and Garcia Imelda
Purchase Details
Closed on
Jun 14, 2001
Sold by
Lopez Alfonso L and Lopez Idolina C
Bought by
Cantu Jesus and Cantu Beatriz A
Purchase Details
Closed on
May 11, 2001
Sold by
Dethloff Roy E and Dethloff Candace L
Bought by
Lopez Alfonso L and Lopez Idolina C
Create a Home Valuation Report for This Property
The Home Valuation Report is an in-depth analysis detailing your home's value as well as a comparison with similar homes in the area
Home Values in the Area
Average Home Value in this Area
Purchase History
| Date | Buyer | Sale Price | Title Company |
|---|---|---|---|
| Garcia Erasmo | -- | None Listed On Document | |
| Garcia Capital Investments Llc | -- | None Listed On Document | |
| Xela Group Inc | -- | None Listed On Document | |
| Garcia Erasmo | -- | None Available | |
| Cantu Jesus | -- | -- | |
| Lopez Alfonso L | -- | -- |
Source: Public Records
Tax History Compared to Growth
Tax History
| Year | Tax Paid | Tax Assessment Tax Assessment Total Assessment is a certain percentage of the fair market value that is determined by local assessors to be the total taxable value of land and additions on the property. | Land | Improvement |
|---|---|---|---|---|
| 2025 | $6,451 | $516,410 | $45,263 | $471,147 |
| 2024 | $6,451 | $458,831 | $25,500 | $433,331 |
| 2023 | $5,173 | $277,871 | $25,500 | $252,371 |
| 2022 | $5,636 | $274,083 | $14,981 | $259,102 |
| 2021 | $5,907 | $274,083 | $14,981 | $259,102 |
| 2020 | $6,226 | $274,083 | $14,981 | $259,102 |
| 2019 | $6,520 | $274,083 | $14,981 | $259,102 |
| 2018 | $3,735 | $260,125 | $14,981 | $245,144 |
| 2017 | $5,895 | $260,125 | $14,981 | $245,144 |
| 2016 | $3,893 | $171,782 | $14,981 | $156,801 |
| 2015 | $3,831 | $171,782 | $14,981 | $156,801 |
| 2014 | $3,831 | $171,782 | $14,981 | $156,801 |
Source: Public Records
Map
Nearby Homes
- 11206 Eastex Fwy
- 4410 Shelton Rd
- 4415 Mooney Rd
- 11375 Allwood St
- 3804 Cedar Hill Ln
- 4007 Wedgewood St
- 9213 Washington St
- 0 Hopper Rd Unit 35613143
- 3418 Hopper Rd
- 0 Cedar Hill Ln Unit 45497108
- 4522 Collins Rd
- 5611 Yorkwood St
- 5613 Annunciation St
- 4809 Edgewater Dr
- 10627 Castleton St
- 5815 Mohawk St
- 5404 Mount Houston Rd
- 10606 Bucknell Rd
- 5618 Briarwick Ln
- 3214 Brea Crest St
- 4432 Hanley Ln
- 4506 Hanley Ln
- 4430 Hanley Ln
- 4510 Hanley Ln
- 4501 Mohawk St
- 4417 Mohawk St
- 4417 Mohawk St
- 4513 Mohawk St
- 4508 Hanley Ln
- 4505 Hanley Ln
- 4433 Hanley Ln
- 4515 Mohawk St
- 4431 Crane St
- 4431 Hanley Ln
- 4517 Hanley Ln
- 4522 Hanley Ln
- 4522 Hanley Ln Unit A
- 4522 Hanley Ln Unit B
- 4418 Hanley Ln
- 4510 Hopper Rd