Estimated Value: $378,000 - $409,000
4
Beds
2
Baths
1,840
Sq Ft
$213/Sq Ft
Est. Value
About This Home
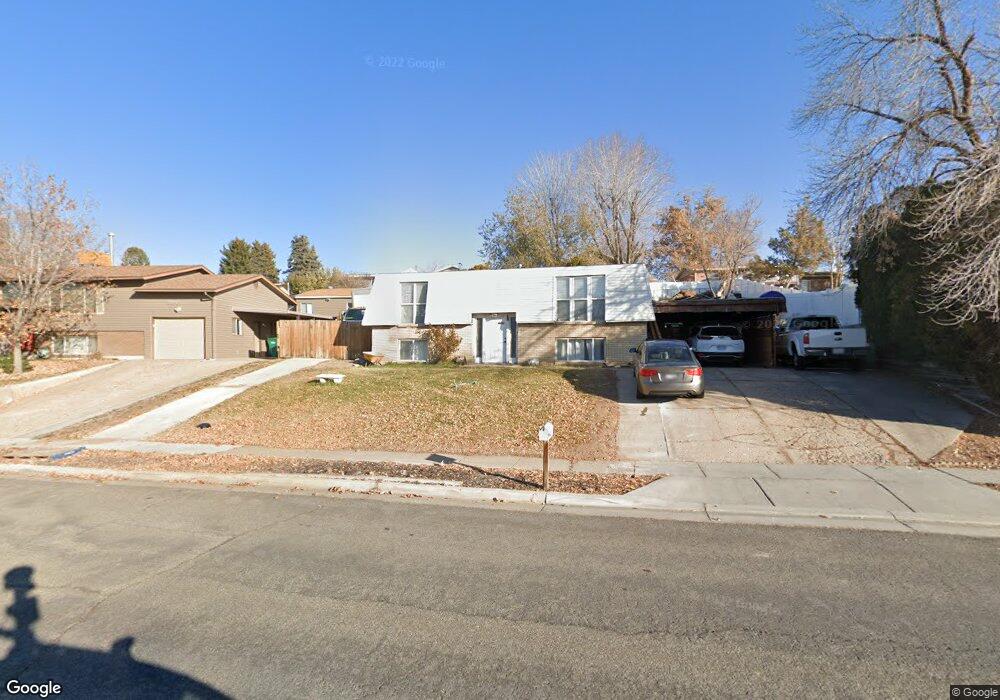
This home is located at 4502 S 2600 W, Roy, UT 84067 and is currently estimated at $392,114, approximately $213 per square foot. 4502 S 2600 W is a home located in Weber County with nearby schools including Valley View School, Sand Ridge Junior High School, and Roy High School.
Ownership History
Date
Name
Owned For
Owner Type
Purchase Details
Closed on
Mar 26, 2010
Sold by
Carrizo Cristian M and Carrizo Christian M
Bought by
Carrizo Cristian M
Current Estimated Value
Home Financials for this Owner
Home Financials are based on the most recent Mortgage that was taken out on this home.
Original Mortgage
$111,262
Outstanding Balance
$73,662
Interest Rate
4.88%
Mortgage Type
FHA
Estimated Equity
$318,452
Purchase Details
Closed on
Mar 17, 2010
Sold by
Gunderson Wayne
Bought by
Carrizo Cristian M
Home Financials for this Owner
Home Financials are based on the most recent Mortgage that was taken out on this home.
Original Mortgage
$111,262
Outstanding Balance
$73,662
Interest Rate
4.88%
Mortgage Type
FHA
Estimated Equity
$318,452
Purchase Details
Closed on
Jun 19, 2006
Sold by
Gunderson Matthew
Bought by
Carrizo Christian M
Home Financials for this Owner
Home Financials are based on the most recent Mortgage that was taken out on this home.
Original Mortgage
$21,500
Interest Rate
6.55%
Mortgage Type
Stand Alone Second
Purchase Details
Closed on
Jun 24, 2004
Sold by
Sdl Enterprises Llc
Bought by
Gunderson Wayne
Purchase Details
Closed on
Jun 1, 2004
Sold by
Gunderson Wayne
Bought by
Coleman Jhon
Purchase Details
Closed on
Aug 4, 2003
Sold by
Gunderson Wayne
Bought by
Coleman Jhon
Purchase Details
Closed on
Mar 17, 2003
Sold by
Layton Steve D
Bought by
Sdl Enterprises Llc
Home Financials for this Owner
Home Financials are based on the most recent Mortgage that was taken out on this home.
Original Mortgage
$82,142
Interest Rate
5.83%
Mortgage Type
Credit Line Revolving
Purchase Details
Closed on
Mar 11, 2003
Sold by
Sdl Enterprises Llc
Bought by
Layton Steve D
Home Financials for this Owner
Home Financials are based on the most recent Mortgage that was taken out on this home.
Original Mortgage
$82,142
Interest Rate
5.83%
Mortgage Type
Credit Line Revolving
Purchase Details
Closed on
Sep 4, 2002
Sold by
Mason Layne B and Mason Kathie L
Bought by
Sdl Enterprises Llc
Create a Home Valuation Report for This Property
The Home Valuation Report is an in-depth analysis detailing your home's value as well as a comparison with similar homes in the area
Home Values in the Area
Average Home Value in this Area
Purchase History
| Date | Buyer | Sale Price | Title Company |
|---|---|---|---|
| Carrizo Cristian M | -- | Attorneys Title Guaranty Fun | |
| Carrizo Cristian M | -- | Attorneys Title Guaranty Fun | |
| Carrizo Christian M | -- | Mountain View Title | |
| Gunderson Wayne | -- | Surety Title | |
| Coleman Jhon | -- | Surety Title | |
| Gunderson Matthew | -- | Surety Title | |
| Coleman Jhon | -- | -- | |
| Sdl Enterprises Llc | -- | Executive Title | |
| Layton Steve D | -- | Executive Title | |
| Sdl Enterprises Llc | $59,100 | -- |
Source: Public Records
Mortgage History
| Date | Status | Borrower | Loan Amount |
|---|---|---|---|
| Open | Carrizo Cristian M | $111,262 | |
| Closed | Carrizo Cristian M | $111,262 | |
| Previous Owner | Carrizo Christian M | $21,500 | |
| Previous Owner | Carrizo Christian M | $86,000 | |
| Previous Owner | Layton Steve D | $82,142 |
Source: Public Records
Tax History Compared to Growth
Tax History
| Year | Tax Paid | Tax Assessment Tax Assessment Total Assessment is a certain percentage of the fair market value that is determined by local assessors to be the total taxable value of land and additions on the property. | Land | Improvement |
|---|---|---|---|---|
| 2025 | $2,272 | $352,858 | $112,695 | $240,163 |
| 2024 | $2,218 | $190,849 | $61,982 | $128,867 |
| 2023 | $2,139 | $184,250 | $61,092 | $123,158 |
| 2022 | $2,039 | $179,850 | $55,729 | $124,121 |
| 2021 | $1,751 | $254,000 | $71,154 | $182,846 |
| 2020 | $1,762 | $237,000 | $71,154 | $165,846 |
| 2019 | $1,650 | $208,000 | $40,995 | $167,005 |
| 2018 | $1,586 | $188,000 | $38,926 | $149,074 |
| 2017 | $1,372 | $150,000 | $35,927 | $114,073 |
| 2016 | $1,375 | $81,327 | $19,141 | $62,186 |
| 2015 | $1,203 | $71,792 | $19,141 | $52,651 |
| 2014 | $1,212 | $71,792 | $19,141 | $52,651 |
Source: Public Records
Map
Nearby Homes
- 2642 W 4400 S
- 1952 W 5450 S
- 2816 W 4400 S
- 2802 W 4375 S
- 4670 S 2525 W
- 4118 Westlake Dr
- 2835 W 4200 S
- 2263 W 4400 S
- 2259 W 4525 S
- 2777 W 4175 S Unit 229
- 2778 W 4175 S Unit 235
- 4635 S 2950 W
- 4875 S 2675 W
- 4164 S 2400 W
- 4022 S 2725 W
- 2979 W 4275 S
- 2411 W 4900 S
- 4328 S 2175 W
- 4919 S 2675 W
- 3014 W 4750 S