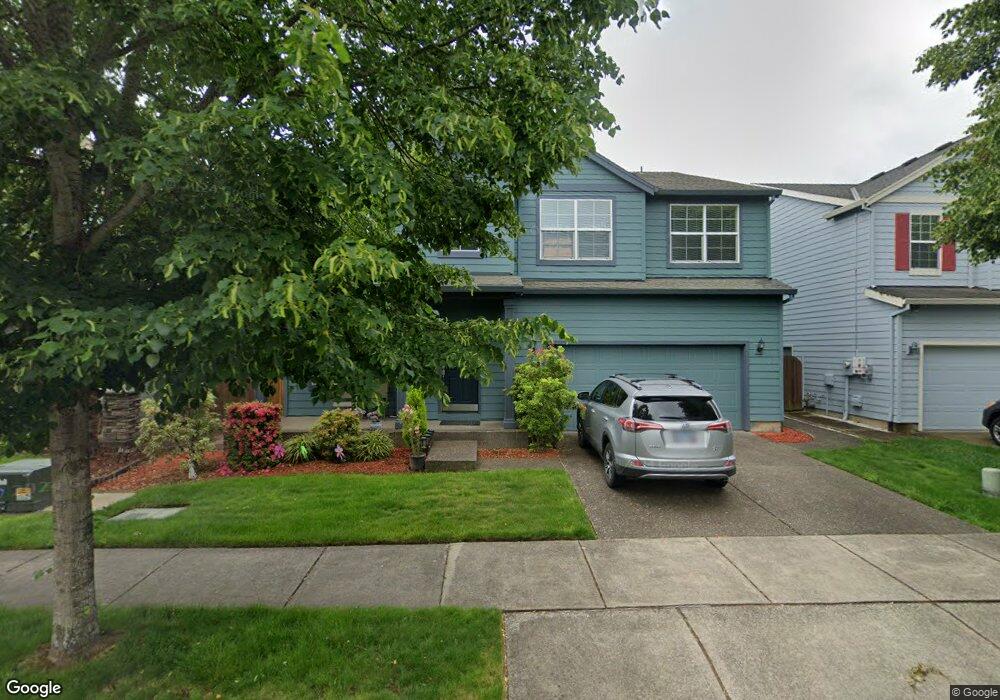
4502 SE Rosewood St Hillsboro, OR 97123
Estimated Value: $632,013 - $678,000
4
Beds
3
Baths
3,042
Sq Ft
$216/Sq Ft
Est. Value
About This Home
This home is located at 4502 SE Rosewood St, Hillsboro, OR 97123 and is currently estimated at $657,253, approximately $216 per square foot. 4502 SE Rosewood St is a home located in Washington County with nearby schools including Witch Hazel Elementary School, South Meadows Middle School, and Hillsboro High School.
Ownership History
Date
Name
Owned For
Owner Type
Purchase Details
Closed on
Aug 26, 2010
Sold by
Federal National Mortgage Association
Bought by
Huynh Tu and Nguyen Ho Thuy T
Current Estimated Value
Home Financials for this Owner
Home Financials are based on the most recent Mortgage that was taken out on this home.
Original Mortgage
$213,600
Outstanding Balance
$141,618
Interest Rate
4.52%
Mortgage Type
New Conventional
Estimated Equity
$515,635
Purchase Details
Closed on
May 19, 2010
Sold by
Richards Robert L
Bought by
Federal National Mortgage Association
Purchase Details
Closed on
May 10, 2007
Sold by
Centex Homes
Bought by
Richards Robert L
Home Financials for this Owner
Home Financials are based on the most recent Mortgage that was taken out on this home.
Original Mortgage
$367,750
Interest Rate
6.17%
Mortgage Type
Unknown
Create a Home Valuation Report for This Property
The Home Valuation Report is an in-depth analysis detailing your home's value as well as a comparison with similar homes in the area
Home Values in the Area
Average Home Value in this Area
Purchase History
| Date | Buyer | Sale Price | Title Company |
|---|---|---|---|
| Huynh Tu | $267,000 | Chicago Title Insurance Co | |
| Federal National Mortgage Association | $436,215 | Fatco | |
| Richards Robert L | $387,811 | First American |
Source: Public Records
Mortgage History
| Date | Status | Borrower | Loan Amount |
|---|---|---|---|
| Open | Huynh Tu | $213,600 | |
| Previous Owner | Richards Robert L | $367,750 |
Source: Public Records
Tax History Compared to Growth
Tax History
| Year | Tax Paid | Tax Assessment Tax Assessment Total Assessment is a certain percentage of the fair market value that is determined by local assessors to be the total taxable value of land and additions on the property. | Land | Improvement |
|---|---|---|---|---|
| 2025 | $5,643 | $345,200 | -- | -- |
| 2024 | $5,482 | $335,150 | -- | -- |
| 2023 | $5,482 | $325,390 | $0 | $0 |
| 2022 | $5,333 | $325,390 | $0 | $0 |
| 2021 | $5,226 | $306,720 | $0 | $0 |
| 2020 | $5,114 | $297,790 | $0 | $0 |
| 2019 | $4,967 | $289,120 | $0 | $0 |
| 2018 | $4,754 | $280,700 | $0 | $0 |
| 2017 | $4,582 | $272,530 | $0 | $0 |
| 2016 | $4,456 | $264,600 | $0 | $0 |
| 2015 | $4,277 | $256,900 | $0 | $0 |
| 2014 | $4,252 | $249,420 | $0 | $0 |
Source: Public Records
Map
Nearby Homes
- 4458 SE Rosewood St
- 3750 SE Twelve Oaks St
- 4537 SE Davis Rd
- 4569 SE Davis Rd
- 4220 SE Rose Petal Place
- 3384 SE Springwood Place
- 4615 SE Olivewood St
- 3321 SE Ironwood Ave
- 3664 86th Ave
- 3632 86th Ave
- 0 SE Davis Rd
- 3570 SE Brookwood Ave
- 3497 SE Brookwood Ave
- 3538 SE Brookwood Ave
- 3522 SE Brookwood Ave
- 3533 SE Everwood Ln
- 5113 SE Davis Rd
- 5145 SE Davis Rd
- 5118 SE Thornapple St
- 5153 SE Davis Rd
- 4494 SE Rosewood St
- 4514 SE Rosewood St
- 4503 SE Oakhurst St
- 4470 SE Rosewood St
- 4497 SE Oakhurst St
- 3871 SE Belle Oak Ave
- 4473 SE Oakhurst St
- 4509 SE Rosewood St
- 4517 SE Rosewood St
- 3893 SE Belle Oak Ave
- 4459 SE Oakhurst St
- 4525 SE Rosewood St
- 0 SE Rosewood St
- 3769 SE Belle Oak Ave
- 4518 SE Oakhurst St
- 4490 SE Oakhurst St
- 3798 SE Scarlet Place
- 4524 SE Oakhurst St
- 4472 SE Oakhurst St
- 4432 SE Rosewood St