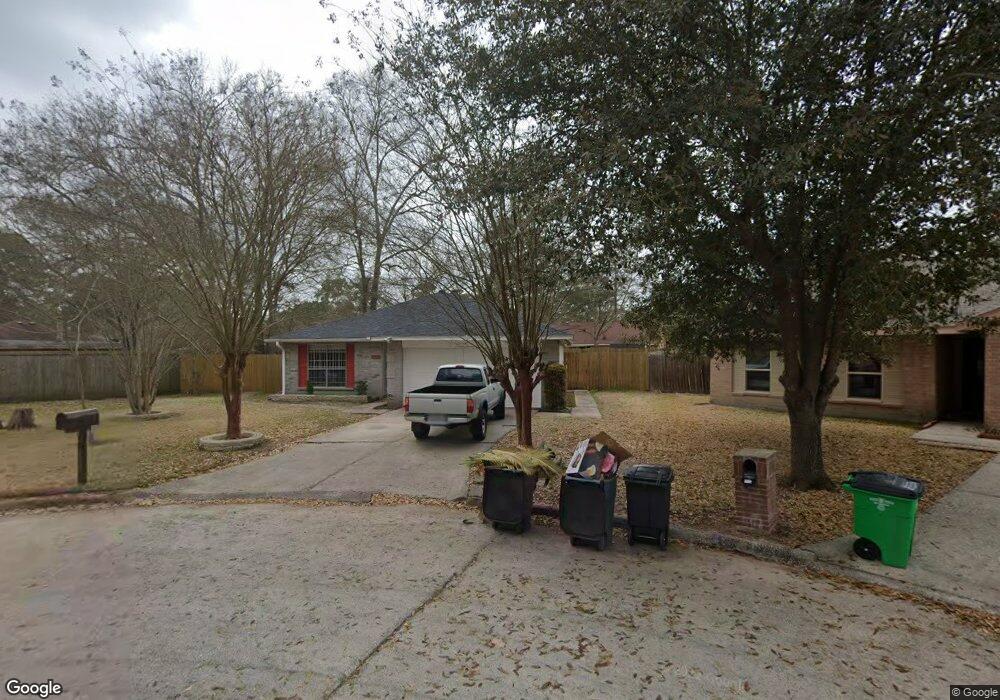
4502 Sloangate Dr Spring, TX 77373
Estimated Value: $190,000 - $223,000
2
Beds
2
Baths
1,125
Sq Ft
$178/Sq Ft
Est. Value
About This Home
This home is located at 4502 Sloangate Dr, Spring, TX 77373 and is currently estimated at $200,768, approximately $178 per square foot. 4502 Sloangate Dr is a home located in Harris County with nearby schools including Mildred Jenkins Elementary School, Dueitt Middle School, and Spring High School.
Ownership History
Date
Name
Owned For
Owner Type
Purchase Details
Closed on
May 14, 2021
Sold by
Benoit Steven Leslie
Bought by
Rios Juan Carlos and Garcia Elizabeth
Current Estimated Value
Purchase Details
Closed on
Nov 5, 2013
Sold by
Driggs Danial and Driggs Kathryn
Bought by
Garcia Elizabeth and Rios Juan C
Purchase Details
Closed on
Oct 21, 1997
Sold by
Held Philip D
Bought by
Driggs Richard A
Home Financials for this Owner
Home Financials are based on the most recent Mortgage that was taken out on this home.
Original Mortgage
$51,510
Interest Rate
7.52%
Mortgage Type
VA
Purchase Details
Closed on
Oct 20, 1994
Sold by
Tyo Allen Lewis
Bought by
Held Philip D
Home Financials for this Owner
Home Financials are based on the most recent Mortgage that was taken out on this home.
Original Mortgage
$45,150
Interest Rate
8.62%
Mortgage Type
Seller Take Back
Create a Home Valuation Report for This Property
The Home Valuation Report is an in-depth analysis detailing your home's value as well as a comparison with similar homes in the area
Home Values in the Area
Average Home Value in this Area
Purchase History
| Date | Buyer | Sale Price | Title Company |
|---|---|---|---|
| Rios Juan Carlos | -- | Momentum Title Llc | |
| Garcia Elizabeth | -- | Stewart Title | |
| Driggs Richard A | -- | Texas American Title Company | |
| Held Philip D | -- | Title Agency #40 |
Source: Public Records
Mortgage History
| Date | Status | Borrower | Loan Amount |
|---|---|---|---|
| Previous Owner | Driggs Richard A | $51,510 | |
| Previous Owner | Held Philip D | $45,150 | |
| Closed | Held Philip D | $1,600 |
Source: Public Records
Tax History Compared to Growth
Tax History
| Year | Tax Paid | Tax Assessment Tax Assessment Total Assessment is a certain percentage of the fair market value that is determined by local assessors to be the total taxable value of land and additions on the property. | Land | Improvement |
|---|---|---|---|---|
| 2025 | $2,939 | $179,861 | $40,024 | $139,837 |
| 2024 | $2,939 | $180,726 | $40,024 | $140,702 |
| 2023 | $2,939 | $184,855 | $40,024 | $144,831 |
| 2022 | $3,475 | $169,664 | $40,024 | $129,640 |
| 2021 | $3,346 | $128,376 | $22,622 | $105,754 |
| 2020 | $3,304 | $125,293 | $22,622 | $102,671 |
| 2019 | $3,113 | $115,912 | $22,622 | $93,290 |
| 2018 | $2,207 | $112,050 | $22,622 | $89,428 |
| 2017 | $2,544 | $112,050 | $22,622 | $89,428 |
| 2016 | $2,313 | $84,287 | $15,662 | $68,625 |
| 2015 | $1,625 | $76,342 | $15,662 | $60,680 |
| 2014 | $1,625 | $66,999 | $15,662 | $51,337 |
Source: Public Records
Map
Nearby Homes
- 23430 Cimber Ln
- 4519 Towergate Dr
- 4523 Towergate Dr
- 4422 Enchantedgate Dr
- 4515 Adonis Dr
- 23430 Wintergate Dr
- 4527 Adonis Dr
- 23602 Wintergate Dr
- 4551 Algernon Dr
- 4330 Tylergate Dr
- 4318 Burkegate Dr
- 4310 Towergate Dr
- 4311 Enchantedgate Dr
- 4303 Chestergate Dr
- 4302 Tylergate Dr
- 4423 Mossygate Dr
- 4411 Monteith Dr
- 4407 Quailgate Dr
- 23531 Montague Dr
- 23122 Cimber Ln
- 4506 Sloangate Dr
- 23518 Newgate Dr
- 23514 Newgate Dr
- 4503 Sloangate Dr
- 23522 Newgate Dr
- 23510 Newgate Dr
- 4503 Towergate Dr
- 4510 Sloangate Dr
- 4507 Towergate Dr
- 4507 Sloangate Dr
- 23526 Newgate Dr
- 4511 Towergate Dr
- 23506 Newgate Dr
- 4511 Sloangate Dr
- 4515 Towergate Dr
- 23530 Newgate Dr
- 4526 Chestergate Dr
- 4515 Sloangate Dr
- 4530 Chestergate Dr
- 4518 Sloangate Dr