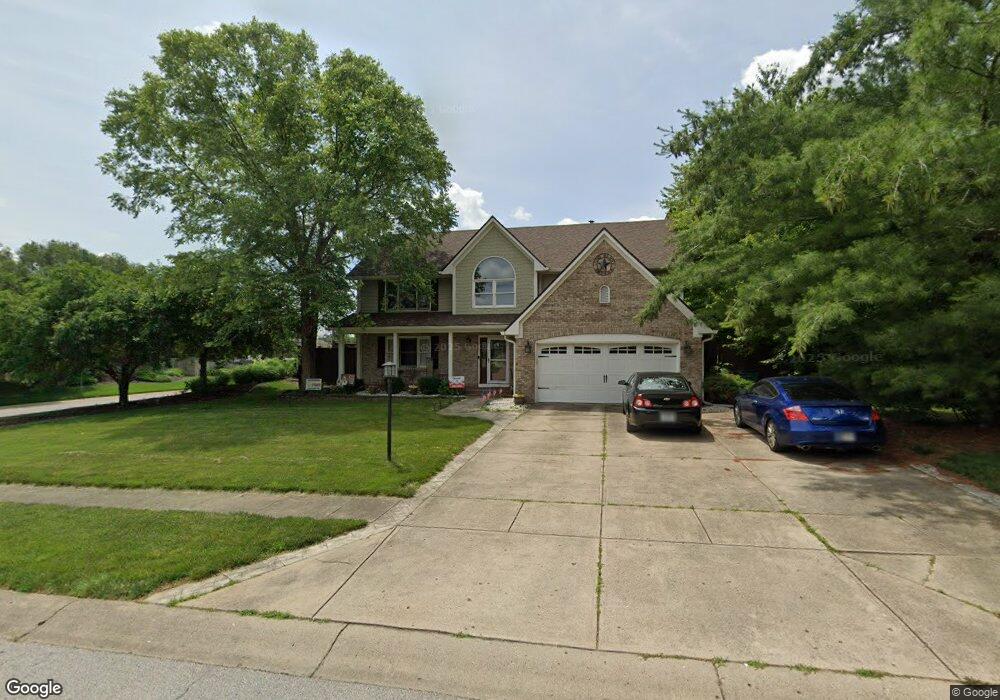
4503 Annelo Cr Greenwood, IN 46142
Frances-Stones Crossing NeighborhoodEstimated Value: $443,649 - $460,000
4
Beds
3
Baths
2,202
Sq Ft
$206/Sq Ft
Est. Value
About This Home
This home is located at 4503 Annelo Cr, Greenwood, IN 46142 and is currently estimated at $454,162, approximately $206 per square foot. 4503 Annelo Cr is a home located in Johnson County with nearby schools including Sugar Grove Elementary School, Center Grove Middle School North, and Center Grove High School.
Ownership History
Date
Name
Owned For
Owner Type
Purchase Details
Closed on
Jun 4, 2021
Sold by
Fisher Joel D and Fisher Susan E
Bought by
Dulaney Zane and Dulaney Melissa
Current Estimated Value
Home Financials for this Owner
Home Financials are based on the most recent Mortgage that was taken out on this home.
Original Mortgage
$316,000
Outstanding Balance
$263,252
Interest Rate
2.9%
Mortgage Type
New Conventional
Estimated Equity
$190,910
Purchase Details
Closed on
May 2, 2016
Sold by
Godsave Matthew J and Godsave Sarah L
Bought by
Fisher Joel D and Fisher Susan E
Home Financials for this Owner
Home Financials are based on the most recent Mortgage that was taken out on this home.
Original Mortgage
$185,000
Interest Rate
3.71%
Mortgage Type
New Conventional
Purchase Details
Closed on
Jul 24, 2008
Sold by
Household Finance Corp Ii
Bought by
Godsave Matthew J and Godsave Sarah L
Home Financials for this Owner
Home Financials are based on the most recent Mortgage that was taken out on this home.
Original Mortgage
$172,900
Interest Rate
6.39%
Mortgage Type
New Conventional
Purchase Details
Closed on
Dec 20, 2007
Sold by
Wright Richard C
Bought by
Household Finance Corp Iii
Create a Home Valuation Report for This Property
The Home Valuation Report is an in-depth analysis detailing your home's value as well as a comparison with similar homes in the area
Home Values in the Area
Average Home Value in this Area
Purchase History
| Date | Buyer | Sale Price | Title Company |
|---|---|---|---|
| Dulaney Zane | -- | None Available | |
| Fisher Joel D | -- | Chicago Title Company Llc | |
| Godsave Matthew J | -- | None Available | |
| Household Finance Corp Iii | $198,994 | None Available |
Source: Public Records
Mortgage History
| Date | Status | Borrower | Loan Amount |
|---|---|---|---|
| Open | Dulaney Zane | $316,000 | |
| Previous Owner | Fisher Joel D | $185,000 | |
| Previous Owner | Godsave Matthew J | $172,900 |
Source: Public Records
Tax History Compared to Growth
Tax History
| Year | Tax Paid | Tax Assessment Tax Assessment Total Assessment is a certain percentage of the fair market value that is determined by local assessors to be the total taxable value of land and additions on the property. | Land | Improvement |
|---|---|---|---|---|
| 2025 | $3,817 | $394,500 | $61,000 | $333,500 |
| 2024 | $3,817 | $381,700 | $61,000 | $320,700 |
| 2023 | $3,867 | $385,000 | $61,000 | $324,000 |
| 2022 | $3,727 | $363,300 | $61,000 | $302,300 |
| 2021 | $2,474 | $261,300 | $61,000 | $200,300 |
| 2020 | $2,316 | $252,100 | $61,000 | $191,100 |
| 2019 | $2,149 | $235,300 | $61,000 | $174,300 |
| 2018 | $2,115 | $235,300 | $61,000 | $174,300 |
| 2017 | $2,046 | $226,600 | $31,100 | $195,500 |
| 2016 | $1,932 | $221,700 | $31,100 | $190,600 |
| 2014 | $1,813 | $203,100 | $31,100 | $172,000 |
| 2013 | $1,813 | $206,600 | $31,100 | $175,500 |
Source: Public Records
Map
Nearby Homes
- 4489 Annelo Dr
- 651 Rylan Cir
- 770 Tulip Ln
- 4637 Walker St
- 852 Yellowwood Dr
- 4672 Churchill Downs Cir
- 4344 Teakwood Ln
- 4342 Sequoia Ct
- 4749 W Smith Valley Rd
- 4157 Songbird Ct
- 4627 Turfway Ct
- 4944 Onslow Ct
- 4103 Oval Place
- Kentmore Basement Plan at Berry Chase
- Drake Basement Plan at Berry Chase
- Berkeley Basement Plan at Berry Chase
- Ainsley II Basement Plan at Berry Chase
- Kensington Plan at Berry Chase
- Columbia Basement Plan at Berry Chase
- Glendale Basement Plan at Berry Chase
- 4503 Annelo Cir
- 4503 Annelo Cir
- 4511 Annelo Cir
- 650 Runyon Rd
- 4523 Annelo Cir
- 4510 Annelo Cir
- 649 Runyon Rd
- 4522 Annelo Cir
- 4471 Annelo Dr
- 624 Runyon Rd
- 4521 W Smith Valley Rd
- 718 Tulip Ln
- 635 S Runyon Rd
- 635 Runyon Rd
- 608 Runyon Rd
- 4572 W Smith Valley Rd
- 4472 Annelo Dr
- 730 Tulip Ln
- 4453 Annelo Dr
- 717 Tulip Ln