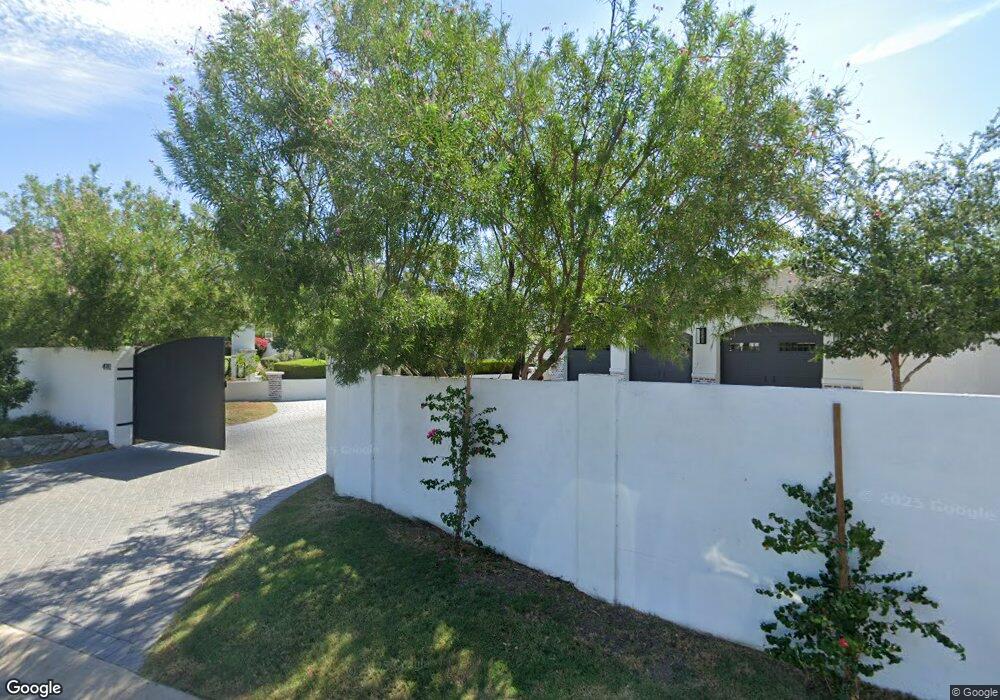
4503 E Camelback Rd Phoenix, AZ 85018
Camelback East Village NeighborhoodEstimated Value: $1,925,000 - $2,863,000
About This Home
This home is located at 4503 E Camelback Rd, Phoenix, AZ 85018 and is currently estimated at $2,396,675, approximately $886 per square foot. 4503 E Camelback Rd is a home located in Maricopa County with nearby schools including Hopi Elementary School, Ingleside Middle School, and Arcadia High School.
Ownership History
We collect this data history from publicly available records. To have your information removed, we recommend requesting removal directly through your county’s website.
Purchase Details
Home Financials for this Owner
Home Financials are based on the most recent Mortgage that was taken out on this home.Purchase Details
Home Financials for this Owner
Home Financials are based on the most recent Mortgage that was taken out on this home.Purchase Details
Home Financials for this Owner
Home Financials are based on the most recent Mortgage that was taken out on this home.Purchase Details
Home Financials for this Owner
Home Financials are based on the most recent Mortgage that was taken out on this home.Purchase Details
Home Financials for this Owner
Home Financials are based on the most recent Mortgage that was taken out on this home.Purchase Details
Purchase Details
Purchase Details
Purchase Details
Purchase Details
Home Financials for this Owner
Home Financials are based on the most recent Mortgage that was taken out on this home.Purchase Details
Purchase Details
Home Financials for this Owner
Home Financials are based on the most recent Mortgage that was taken out on this home.Purchase Details
Home Financials for this Owner
Home Financials are based on the most recent Mortgage that was taken out on this home.Purchase Details
Home Financials for this Owner
Home Financials are based on the most recent Mortgage that was taken out on this home.Purchase Details
Purchase Details
Home Financials for this Owner
Home Financials are based on the most recent Mortgage that was taken out on this home.Purchase Details
Home Values in the Area
Average Home Value in this Area
Purchase History
We collect this data history from publicly available records. To have your information removed, we recommend requesting removal directly through your county’s website.
| Date | Buyer | Sale Price | Title Company |
|---|---|---|---|
| -- | Magnus Title Agency | ||
| $860,000 | Magnus Title Agency | ||
| -- | Magnus Title Agency | ||
| -- | None Available | ||
| -- | None Available | ||
| -- | None Available | ||
| -- | None Available | ||
| -- | None Available | ||
| $427,000 | None Available | ||
| $630,000 | Equity Title Agency Inc | ||
| $894,795 | First American Title | ||
| $1,200,000 | Security Title Agency Inc | ||
| -- | Security Title Agency Inc | ||
| -- | Security Title Agency Inc | ||
| -- | Fidelity National Title | ||
| $430,000 | Stewart Title & Trust Of Pho | ||
| -- | Security Title Agency | ||
| $195,000 | Ati Title Agency |
Mortgage History
We collect this data history from publicly available records. To have your information removed, we recommend requesting removal directly through your county’s website.
| Date | Status | Borrower | Loan Amount |
|---|---|---|---|
| Open | $568,000 | ||
| Closed | $245,000 | ||
| Closed | $100,000 | ||
| Closed | $645,000 | ||
| Previous Owner | $65,000 | ||
| Previous Owner | -- | ||
| Previous Owner | $149,937 | ||
| Previous Owner | $417,000 | ||
| Previous Owner | $840,000 | ||
| Previous Owner | $300,000 | ||
| Previous Owner | $960,000 | ||
| Previous Owner | $720,000 | ||
| Previous Owner | $430,883 | ||
| Previous Owner | $412,500 |
Tax History
We collect this data history from publicly available records. To have your information removed, we recommend requesting removal directly through your county’s website.
| Year | Tax Paid | Tax Assessment Tax Assessment Total Assessment is a certain percentage of the fair market value that is determined by local assessors to be the total taxable value of land and additions on the property. | Land | Improvement |
|---|---|---|---|---|
| 2025 | $7,097 | $93,524 | ||
| 2024 | $6,603 | $89,071 | ||
| 2023 | $6,603 | $141,750 | $28,350 | $113,400 |
| 2022 | $6,308 | $107,650 | $21,530 | $86,120 |
| 2021 | $6,560 | $103,560 | $20,710 | $82,850 |
| 2020 | $6,455 | $94,400 | $18,880 | $75,520 |
| 2019 | $6,190 | $87,750 | $17,550 | $70,200 |
| 2018 | $5,930 | $72,110 | $14,420 | $57,690 |
| 2017 | $5,674 | $73,820 | $14,760 | $59,060 |
| 2016 | $5,512 | $77,270 | $15,450 | $61,820 |
| 2015 | $5,003 | $73,610 | $14,720 | $58,890 |
Map
- 4450 E Camelback Rd Unit 1
- 4737 E Exeter Blvd
- 4549 E Calle Ventura
- 4540 N 44th St Unit 27
- 4540 N 44th St Unit 3
- 4164 E Camelback Rd
- 4248 E Patricia Jane Dr
- 4244 E Patricia Jane Dr
- 4937 E Rockridge Rd
- 4201 E Camelback Rd Unit 41
- 4610 E Calle Ventura
- 4618 E Calle Ventura
- 4853 E White Gates Dr Unit 11
- 4440 E Campbell Ave
- 5341 N 46th St
- 4727 E Lafayette Blvd Unit 208
- 4114 E Calle Redonda Unit 54
- 4114 E Calle Redonda Unit 56
- 4118 E Calle Redonda Unit 78
- 4111 E Camelback Rd Unit 17
- 4911 N 45th St
- 4513 E Camelback Rd
- 4512 E Exeter Blvd
- 4912 N 45th St
- 4521 E Camelback Rd
- 4912 N 45th Place
- 4902 N 45th St
- 4902 N 45th Place
- 4520 E Exeter Blvd
- 4524 E Camelback Rd
- 5001 N 45th Place
- 4531 E Camelback Rd
- 4531 E Camelback Rd
- 4531 E Camelback Rd
- 4531 E Camelback Rd
- 4501 E Exeter Blvd
- 4915 N 45th Place
- 4511 E Exeter Blvd
- 4445 E Exeter Blvd
- 4445 E Exeter Blvd
Ask me questions while you tour the home.