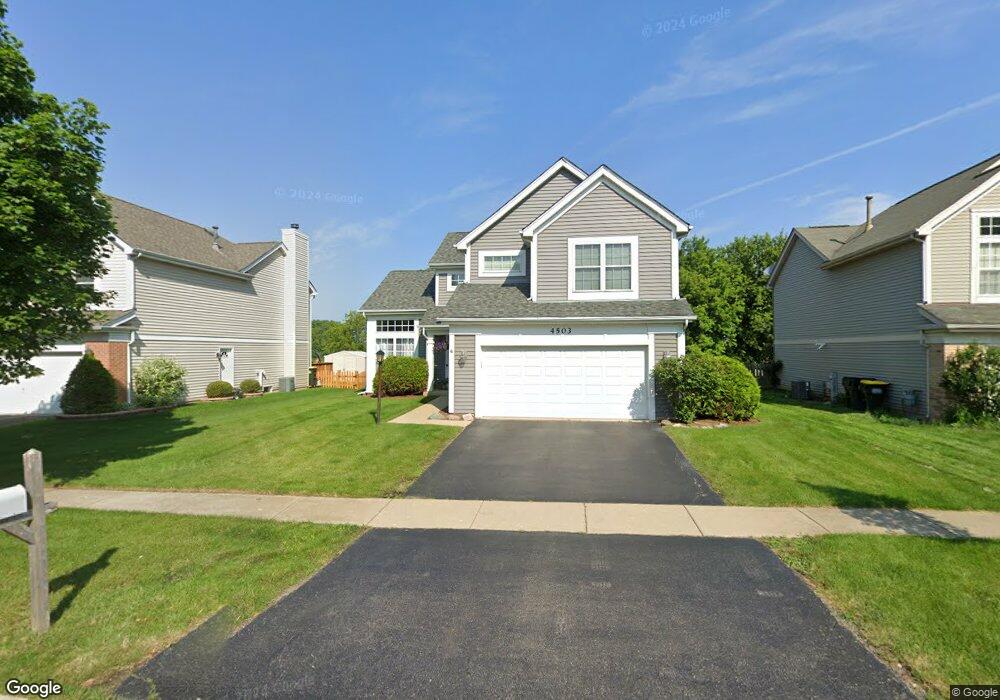
4503 Rolling Hills Dr Unit 4 Lake In the Hills, IL 60156
Estimated Value: $370,947 - $402,000
--
Bed
--
Bath
1,776
Sq Ft
$221/Sq Ft
Est. Value
About This Home
This home is located at 4503 Rolling Hills Dr Unit 4, Lake In the Hills, IL 60156 and is currently estimated at $391,987, approximately $220 per square foot. 4503 Rolling Hills Dr Unit 4 is a home located in McHenry County with nearby schools including Mackeben Elementary School, Conley Elementary School, and Heineman Middle School.
Ownership History
Date
Name
Owned For
Owner Type
Purchase Details
Closed on
Feb 25, 2020
Sold by
Kiolbassa John and Kiolbassa Ellen
Bought by
Kiolbassa John W and Kiolbassa Ellen M
Current Estimated Value
Purchase Details
Closed on
Feb 28, 2003
Sold by
Kiolbassa John and Kiolbassa Ellen
Bought by
Kiolbassa John and Kiolbassa Ellen
Home Financials for this Owner
Home Financials are based on the most recent Mortgage that was taken out on this home.
Original Mortgage
$152,000
Outstanding Balance
$65,917
Interest Rate
6%
Estimated Equity
$326,070
Purchase Details
Closed on
Oct 10, 1994
Sold by
American National Bk&Tr Co Of Chicago
Bought by
Kiolbassa John and Browne Ellen
Home Financials for this Owner
Home Financials are based on the most recent Mortgage that was taken out on this home.
Original Mortgage
$125,000
Interest Rate
8.37%
Create a Home Valuation Report for This Property
The Home Valuation Report is an in-depth analysis detailing your home's value as well as a comparison with similar homes in the area
Home Values in the Area
Average Home Value in this Area
Purchase History
| Date | Buyer | Sale Price | Title Company |
|---|---|---|---|
| Kiolbassa John W | -- | None Available | |
| Kiolbassa John | -- | Multiple | |
| Kiolbassa John | $160,500 | Northern Land Title Corp |
Source: Public Records
Mortgage History
| Date | Status | Borrower | Loan Amount |
|---|---|---|---|
| Open | Kiolbassa John | $152,000 | |
| Closed | Kiolbassa John | $125,000 |
Source: Public Records
Tax History Compared to Growth
Tax History
| Year | Tax Paid | Tax Assessment Tax Assessment Total Assessment is a certain percentage of the fair market value that is determined by local assessors to be the total taxable value of land and additions on the property. | Land | Improvement |
|---|---|---|---|---|
| 2024 | $7,530 | $109,834 | $7,919 | $101,915 |
| 2023 | $7,324 | $98,665 | $7,114 | $91,551 |
| 2022 | $7,010 | $89,843 | $6,478 | $83,365 |
| 2021 | $6,788 | $84,614 | $6,101 | $78,513 |
| 2020 | $6,692 | $82,357 | $5,938 | $76,419 |
| 2019 | $6,528 | $80,254 | $5,786 | $74,468 |
| 2018 | $6,178 | $74,863 | $6,512 | $68,351 |
| 2017 | $6,053 | $70,552 | $6,137 | $64,415 |
| 2016 | $6,104 | $67,078 | $5,835 | $61,243 |
| 2013 | -- | $58,327 | $10,710 | $47,617 |
Source: Public Records
Map
Nearby Homes
- 4535 Heron Dr
- 2191 Litchfield Ln
- 9103 Miller Rd Unit 4
- 9103 Miller Rd Unit 5
- 9103 Miller Rd Unit 3
- 9103 Miller Rd Unit 2
- 9103 Miller Rd Unit 1
- 10 Barrington Ct
- 10 Ronan Ct
- 2948 Impressions Dr
- 2521 Waterford Ln
- 1578 Grouse Way
- 2 Melbourne Ct
- 3218 Impressions Dr
- 2350 Stanton Cir
- 20 Dogwood Ct
- 1484 Rolling Hills Dr
- 9012 Swanson Rd
- 4761 Highwood Ln
- 12 Baldwin Ct
- 4513 Rolling Hills Dr
- 4493 Rolling Hills Dr
- 4523 Rolling Hills Dr
- 4483 Rolling Hills Dr
- 2 Middlefield Ct
- 4533 Rolling Hills Dr
- 4510 Rolling Hills Dr
- 4473 Rolling Hills Dr
- 4 Middlefield Ct
- 4543 Rolling Hills Dr
- 1 Middlefield Ct
- 4463 Rolling Hills Dr Unit 4
- 4520 Rolling Hills Dr
- 6 Middlefield Ct
- 3 Middlefield Ct
- 4553 Rolling Hills Dr Unit 4
- 4530 Rolling Hills Dr
- 8 Middlefield Ct
- 2 Westminster Ct
- 4563 Rolling Hills Dr