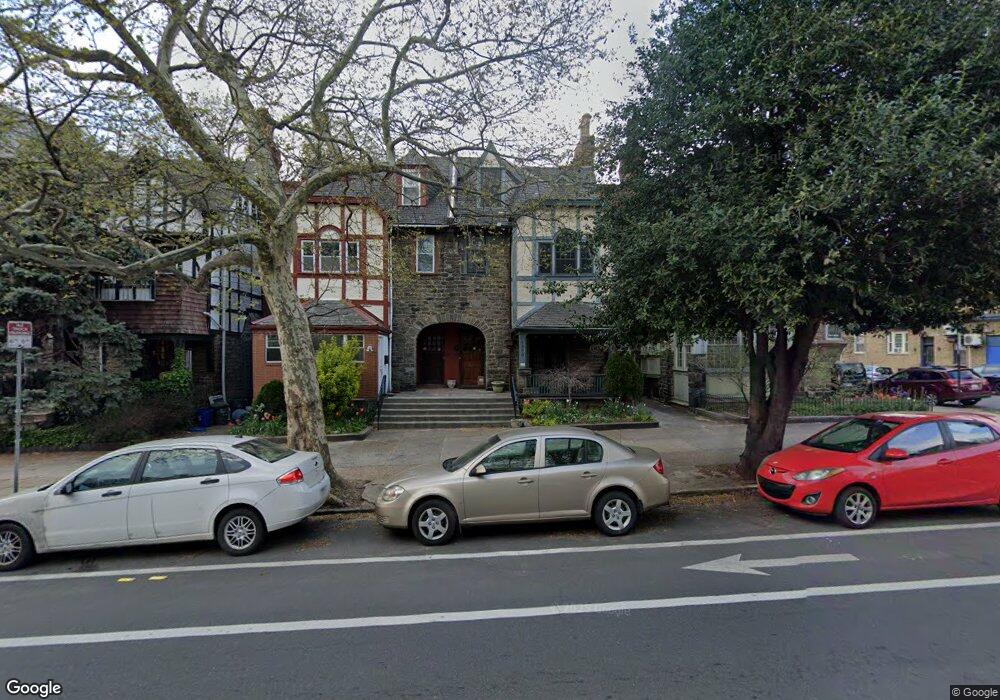
4503 Spruce St Philadelphia, PA 19139
Spruce Hill NeighborhoodEstimated Value: $592,000 - $730,000
5
Beds
3
Baths
1,980
Sq Ft
$337/Sq Ft
Est. Value
About This Home
This home is located at 4503 Spruce St, Philadelphia, PA 19139 and is currently estimated at $667,885, approximately $337 per square foot. 4503 Spruce St is a home located in Philadelphia County with nearby schools including Penn Alexander School, West Philadelphia High School, and The Islamic Education School (TIES).
Ownership History
Date
Name
Owned For
Owner Type
Purchase Details
Closed on
Apr 24, 2009
Sold by
Anderson Thomas E
Bought by
Senker Jessica H and Donlen Brian D
Current Estimated Value
Home Financials for this Owner
Home Financials are based on the most recent Mortgage that was taken out on this home.
Original Mortgage
$343,660
Outstanding Balance
$217,132
Interest Rate
4.93%
Mortgage Type
FHA
Estimated Equity
$450,753
Purchase Details
Closed on
Jun 29, 2005
Sold by
Fitzgerald David and Fitzgerald Elizabeth
Bought by
Anderson Thomas E
Home Financials for this Owner
Home Financials are based on the most recent Mortgage that was taken out on this home.
Original Mortgage
$391,200
Interest Rate
5.75%
Mortgage Type
Stand Alone First
Purchase Details
Closed on
Aug 24, 2001
Sold by
Harrington Clarence and Estate Of Clarence Scott Harri
Bought by
Fitzgerald David P and Fitzgerald Elizabeth
Home Financials for this Owner
Home Financials are based on the most recent Mortgage that was taken out on this home.
Original Mortgage
$175,200
Interest Rate
7.05%
Create a Home Valuation Report for This Property
The Home Valuation Report is an in-depth analysis detailing your home's value as well as a comparison with similar homes in the area
Home Values in the Area
Average Home Value in this Area
Purchase History
| Date | Buyer | Sale Price | Title Company |
|---|---|---|---|
| Senker Jessica H | $350,000 | Lawyers Title Ins | |
| Anderson Thomas E | $489,000 | -- | |
| Fitzgerald David P | $146,000 | -- |
Source: Public Records
Mortgage History
| Date | Status | Borrower | Loan Amount |
|---|---|---|---|
| Open | Senker Jessica H | $343,660 | |
| Previous Owner | Anderson Thomas E | $391,200 | |
| Previous Owner | Fitzgerald David P | $175,200 |
Source: Public Records
Tax History Compared to Growth
Tax History
| Year | Tax Paid | Tax Assessment Tax Assessment Total Assessment is a certain percentage of the fair market value that is determined by local assessors to be the total taxable value of land and additions on the property. | Land | Improvement |
|---|---|---|---|---|
| 2025 | $7,488 | $654,899 | $130,980 | $523,919 |
| 2024 | $7,488 | $654,899 | $130,980 | $523,919 |
| 2023 | $7,488 | $534,899 | $106,980 | $427,919 |
| 2022 | $5,280 | $502,900 | $106,980 | $395,920 |
| 2021 | $5,728 | $0 | $0 | $0 |
| 2020 | $5,728 | $0 | $0 | $0 |
| 2019 | $5,522 | $0 | $0 | $0 |
| 2018 | $5,252 | $0 | $0 | $0 |
| 2017 | $5,252 | $0 | $0 | $0 |
| 2016 | $4,916 | $0 | $0 | $0 |
| 2015 | $4,706 | $0 | $0 | $0 |
| 2014 | -- | $375,200 | $91,200 | $284,000 |
| 2012 | -- | $34,208 | $10,049 | $24,159 |
Source: Public Records
Map
Nearby Homes
- 233 S 45th St
- 238 S 45th St
- 236 S 45th St
- 236 Buckingham Place
- 230 S 45th St
- 218 S 45th St
- 4401 Pine St
- 211 S 45th St
- 257 S 46th St
- 251 S 46th St
- 4312 Spruce St
- 4521 Osage Ave
- 4310 Pine St
- 4620 Locust St
- 4622 Locust St
- 4637 Pine St Unit D311
- 4637 Pine St Unit D410
- 4530 Sansom St
- 513 S 46th St
- 4542 Sansom St
- 4501 Spruce St
- 4505 Spruce St
- 4507 Spruce St
- 260 S 45th St
- 4511 Spruce St
- 258 S 45th St
- 4509 Spruce St
- 256 S 45th St
- 4513 Spruce St
- 4513 Spruce St Unit 3R
- 4513 Spruce St Unit 2
- 254 S 45th St
- 4441 Spruce St Unit 3-3
- 4441 Spruce St Unit 5
- 4441 Spruce St Unit 4
- 4441 Spruce St Unit 3
- 4441 Spruce St Unit 2
- 4441 Spruce St
- 4515 Spruce St
- 252 S 45th St