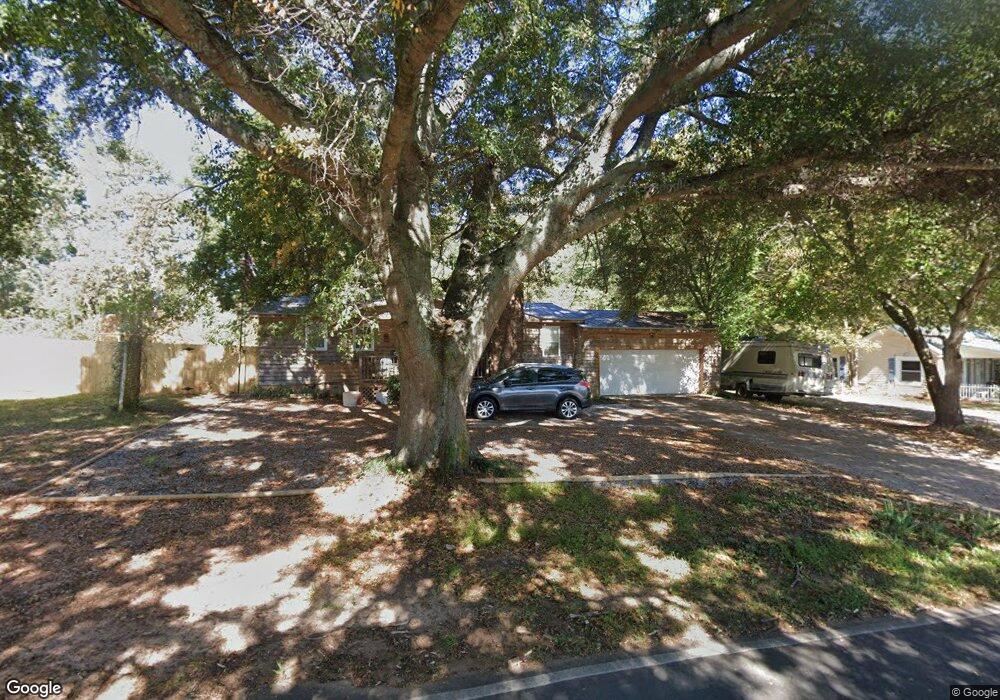
4503 Strickland Rd Flowery Branch, GA 30542
Estimated Value: $245,000 - $319,000
3
Beds
2
Baths
1,152
Sq Ft
$245/Sq Ft
Est. Value
About This Home
This home is located at 4503 Strickland Rd, Flowery Branch, GA 30542 and is currently estimated at $282,211, approximately $244 per square foot. 4503 Strickland Rd is a home located in Hall County with nearby schools including Chestnut Mountain Elementary School, South Hall Middle School, and Johnson High School.
Ownership History
Date
Name
Owned For
Owner Type
Purchase Details
Closed on
Dec 28, 2011
Sold by
Federal Home Loan Mortgage Corporation
Bought by
Craig Tyler and Craig Elizabeth
Current Estimated Value
Purchase Details
Closed on
Jun 7, 2011
Sold by
Bac Home Loans Servicing Lp
Bought by
Federal Home Loan Mortgage Corporation
Purchase Details
Closed on
Oct 31, 2005
Sold by
Hsbc Bank
Bought by
Lopez Pablo
Home Financials for this Owner
Home Financials are based on the most recent Mortgage that was taken out on this home.
Original Mortgage
$113,000
Interest Rate
5.84%
Mortgage Type
New Conventional
Purchase Details
Closed on
Jul 5, 2005
Sold by
Hill Joyce Elaine
Bought by
Hsbc Bank Usa
Purchase Details
Closed on
Mar 26, 2002
Sold by
Hill Elaine W
Bought by
Hill Joyce Elaine
Create a Home Valuation Report for This Property
The Home Valuation Report is an in-depth analysis detailing your home's value as well as a comparison with similar homes in the area
Home Values in the Area
Average Home Value in this Area
Purchase History
| Date | Buyer | Sale Price | Title Company |
|---|---|---|---|
| Craig Tyler | $47,000 | -- | |
| Federal Home Loan Mortgage Corporation | -- | -- | |
| Bac Home Loans Servicing Lp | $70,000 | -- | |
| Lopez Pablo | $113,000 | -- | |
| Hsbc Bank Usa | $90,896 | -- | |
| Hill Joyce Elaine | -- | -- |
Source: Public Records
Mortgage History
| Date | Status | Borrower | Loan Amount |
|---|---|---|---|
| Previous Owner | Lopez Pablo | $113,000 |
Source: Public Records
Tax History Compared to Growth
Tax History
| Year | Tax Paid | Tax Assessment Tax Assessment Total Assessment is a certain percentage of the fair market value that is determined by local assessors to be the total taxable value of land and additions on the property. | Land | Improvement |
|---|---|---|---|---|
| 2024 | $1,812 | $70,400 | $14,840 | $55,560 |
| 2023 | $1,750 | $67,880 | $14,840 | $53,040 |
| 2022 | $1,583 | $58,640 | $14,840 | $43,800 |
| 2021 | $911 | $31,880 | $9,440 | $22,440 |
| 2020 | $877 | $29,720 | $8,160 | $21,560 |
| 2019 | $804 | $26,760 | $8,160 | $18,600 |
| 2018 | $784 | $25,200 | $8,160 | $17,040 |
| 2017 | $760 | $24,600 | $8,160 | $16,440 |
| 2016 | $757 | $25,120 | $8,640 | $16,480 |
| 2015 | $721 | $23,600 | $4,520 | $19,080 |
| 2014 | $721 | $23,600 | $4,520 | $19,080 |
Source: Public Records
Map
Nearby Homes
- 4835 Upper Berkshire Rd
- 4610 Blakeford Ct
- 4478 Longmead Rd
- 4559 Winder Hwy
- 4211 Quail Creek Dr
- 4998 Planters Way
- 4577 Winder Hwy
- 4446 Union Church Rd
- 4708 Upper Berkshire Rd Unit 39
- 4226 Quail Creek Dr
- 4439 Oxburgh Park
- 4234 Quail Creek Dr
- 4434 Oxburgh Park
- 4135 Ashford Way
- 4315 Marble Arch Way
- 0 Marble Arch Way
- 4621 Chartwell Chase Ct
- 4509 Strickland Rd
- 4477 Strickland Rd
- 4515 Strickland Rd
- 4516 Cash Dr
- 4517 Cash Dr
- 4519 Strickland Rd
- 4473 Strickland Rd
- 4506 Strickland Blvd
- 4505 Strickland Blvd
- 4480 Strickland Rd
- 4523 Cash Dr
- 4526 Cash Dr Unit 11
- 0 Strickland Rd Unit 8364677
- 4604 Youngblood Rd
- 4476 Strickland Rd
- 4511 Strickland Blvd
- 4530 Cash Dr
- 4516 Strickland Blvd
- 4470 Strickland Rd
- 4463 Strickland Rd