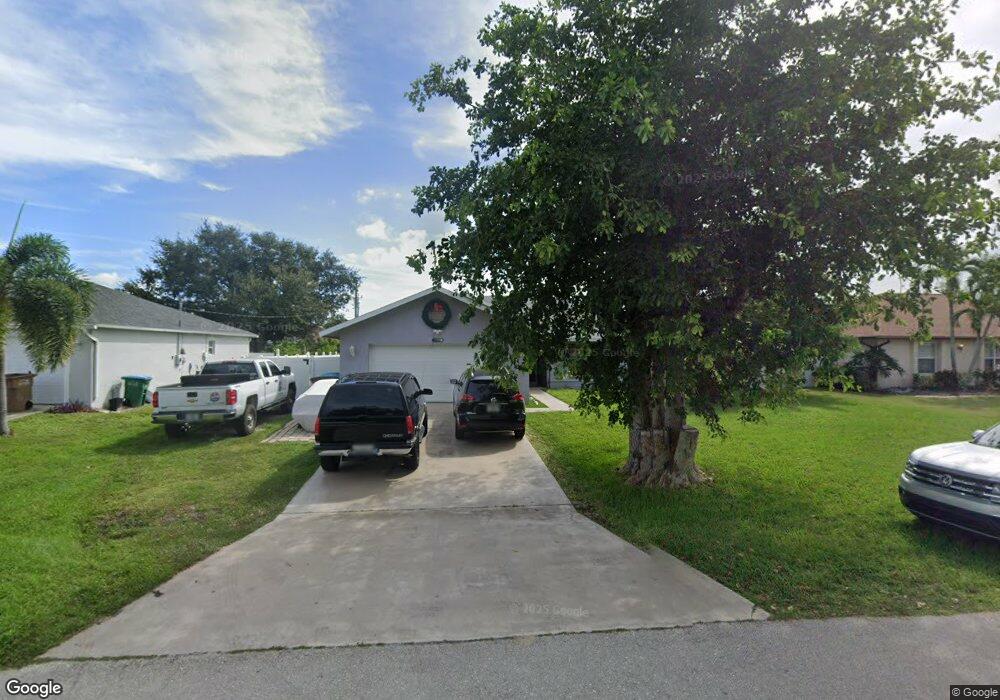
4503 SW 7th Ave Cape Coral, FL 33914
Pelican NeighborhoodEstimated Value: $318,000 - $369,000
3
Beds
2
Baths
1,722
Sq Ft
$196/Sq Ft
Est. Value
About This Home
This home is located at 4503 SW 7th Ave, Cape Coral, FL 33914 and is currently estimated at $338,220, approximately $196 per square foot. 4503 SW 7th Ave is a home located in Lee County with nearby schools including Cape Elementary School, Caloosa Elementary School, and Tropic Isles Elementary School.
Ownership History
Date
Name
Owned For
Owner Type
Purchase Details
Closed on
Nov 27, 2017
Sold by
Selorel Florida Corp
Bought by
Cagigas Robert
Current Estimated Value
Home Financials for this Owner
Home Financials are based on the most recent Mortgage that was taken out on this home.
Original Mortgage
$93,279
Outstanding Balance
$79,466
Interest Rate
4.5%
Mortgage Type
FHA
Estimated Equity
$258,754
Purchase Details
Closed on
Feb 17, 2010
Sold by
Cagigas Evelina J and Cagigas Robert
Bought by
Selorel Florida Corp
Purchase Details
Closed on
Aug 23, 2006
Sold by
Gordon John D and Gordon Norma A
Bought by
Cagigas Robert and Cagigas Evelinn J
Home Financials for this Owner
Home Financials are based on the most recent Mortgage that was taken out on this home.
Original Mortgage
$204,000
Interest Rate
9.2%
Mortgage Type
Balloon
Create a Home Valuation Report for This Property
The Home Valuation Report is an in-depth analysis detailing your home's value as well as a comparison with similar homes in the area
Home Values in the Area
Average Home Value in this Area
Purchase History
| Date | Buyer | Sale Price | Title Company |
|---|---|---|---|
| Cagigas Robert | $95,000 | None Available | |
| Selorel Florida Corp | $74,000 | Attorney | |
| Cagigas Robert | $255,000 | Cape Coral Title Insurance A |
Source: Public Records
Mortgage History
| Date | Status | Borrower | Loan Amount |
|---|---|---|---|
| Open | Cagigas Robert | $93,279 | |
| Previous Owner | Cagigas Robert | $204,000 |
Source: Public Records
Tax History Compared to Growth
Tax History
| Year | Tax Paid | Tax Assessment Tax Assessment Total Assessment is a certain percentage of the fair market value that is determined by local assessors to be the total taxable value of land and additions on the property. | Land | Improvement |
|---|---|---|---|---|
| 2025 | $2,916 | $179,591 | -- | -- |
| 2024 | $2,783 | $171,159 | -- | -- |
| 2023 | $2,783 | $166,174 | $0 | $0 |
| 2022 | $2,570 | $161,334 | $0 | $0 |
| 2021 | $2,586 | $174,671 | $37,000 | $137,671 |
| 2020 | $2,606 | $154,472 | $0 | $0 |
| 2019 | $2,520 | $150,999 | $31,500 | $119,499 |
| 2018 | $2,588 | $152,612 | $30,000 | $122,612 |
| 2017 | $3,167 | $151,002 | $25,000 | $126,002 |
| 2016 | $2,930 | $138,158 | $25,000 | $113,158 |
| 2015 | $2,692 | $119,294 | $15,200 | $104,094 |
| 2014 | -- | $108,797 | $11,800 | $96,997 |
| 2013 | -- | $97,896 | $9,800 | $88,096 |
Source: Public Records
Map
Nearby Homes
- 4417 SW 6th Place
- 4404 SW 7th Ave
- 4502 SW 6th Ave
- 4528 SW 7th Place
- 4538 SW 6th Place
- 4414 SW 5th Place
- 4520 Skyline Blvd Unit 208
- 4602 Skyline Blvd
- 619 SW 43rd Ln
- 4416 SW 5th Ave
- 4618 SW 7th Ave
- 4424 SW 8th Place Unit 14
- 4514 SW 8th Place Unit 11
- 4513 SW 8th Ct Unit 109
- 4513 SW 8th Ct Unit 113
- 4513 SW 8th Ct Unit 117
- 4616 Skyline Blvd Unit 104
- 724 SW 47th St Unit 205
- 710 SW 47th St Unit 103
- 4627 SW 5th Place
- 4417 SW 7th Ave
- 4507 SW 7th Ave
- 4502 SW 6th Place
- 4416 SW 6th Place
- 4506 SW 6th Place
- 4413 SW 7th Ave Unit 9
- 4502 SW 7th Ave
- 4506 SW 7th Ave
- 4412 SW 6th Place
- 4510 SW 6th Place
- 4510 SW 7th Ave
- 4412 SW 7th Ave
- 4409 SW 7th Ave
- 4408 SW 6th Place
- 4514 SW 7th Ave Unit 44
- 4514 SW 7th Ave
- 712/714 SW 45th St
- 4408 SW 7th Ave
- 4503 SW 6th Place
- 4507 SW 6th Place