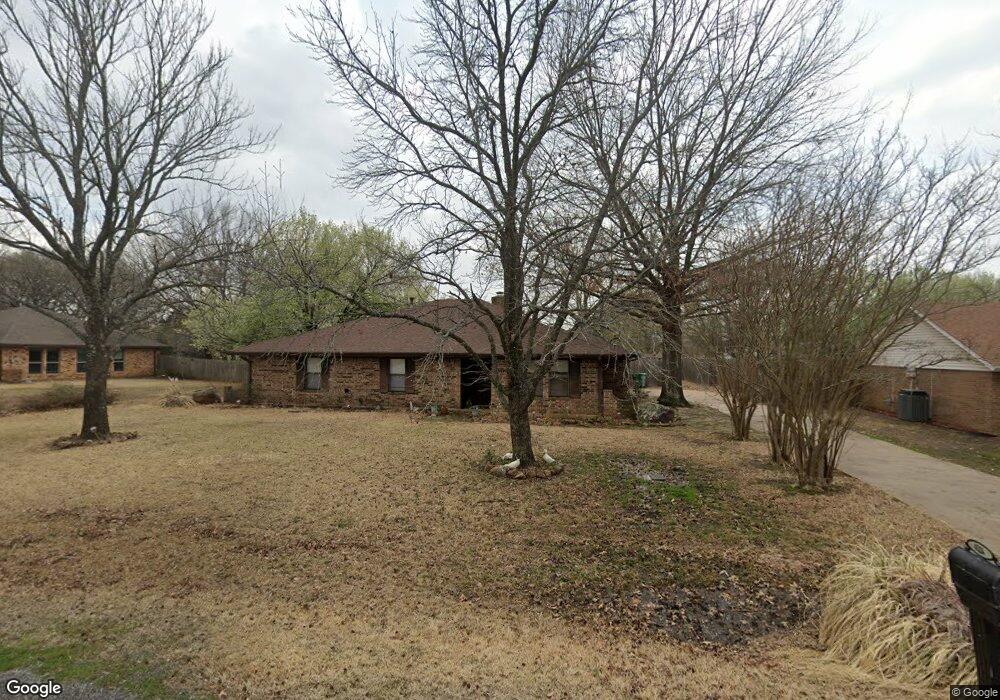
4504 Arroyo Trail Sherman, TX 75090
Estimated Value: $303,999 - $370,000
4
Beds
2
Baths
2,202
Sq Ft
$158/Sq Ft
Est. Value
About This Home
This home is located at 4504 Arroyo Trail, Sherman, TX 75090 and is currently estimated at $348,000, approximately $158 per square foot. 4504 Arroyo Trail is a home located in Grayson County with nearby schools including Percy W. Neblett Elementary School, Dillingham Intermediate School, and Piner Middle School.
Ownership History
Date
Name
Owned For
Owner Type
Purchase Details
Closed on
Aug 15, 2008
Sold by
Wachovia Bank Na
Bought by
Aldridge Johnny W and Aldridge Sheila A
Current Estimated Value
Purchase Details
Closed on
May 6, 2008
Sold by
Bell Tonya Erin
Bought by
Wachovia Bank Na and Noteholders Of Aegis Asset Backed Securi
Purchase Details
Closed on
May 31, 2005
Sold by
Va
Bought by
Bell Tonya Erin
Home Financials for this Owner
Home Financials are based on the most recent Mortgage that was taken out on this home.
Original Mortgage
$24,700
Interest Rate
5.78%
Mortgage Type
Stand Alone Second
Purchase Details
Closed on
Feb 15, 2005
Sold by
Washington Mutual Bank Fa
Bought by
Va
Purchase Details
Closed on
Feb 1, 2005
Sold by
Martin Mickey and Martin Brenda
Bought by
Washington Mutual Bank Fa
Create a Home Valuation Report for This Property
The Home Valuation Report is an in-depth analysis detailing your home's value as well as a comparison with similar homes in the area
Home Values in the Area
Average Home Value in this Area
Purchase History
| Date | Buyer | Sale Price | Title Company |
|---|---|---|---|
| Aldridge Johnny W | -- | Sherman Title | |
| Wachovia Bank Na | $112,160 | None Available | |
| Bell Tonya Erin | -- | -- | |
| Va | -- | -- | |
| Washington Mutual Bank Fa | $99,147 | -- |
Source: Public Records
Mortgage History
| Date | Status | Borrower | Loan Amount |
|---|---|---|---|
| Previous Owner | Bell Tonya Erin | $24,700 | |
| Previous Owner | Bell Tonya Erin | $99,000 |
Source: Public Records
Tax History Compared to Growth
Tax History
| Year | Tax Paid | Tax Assessment Tax Assessment Total Assessment is a certain percentage of the fair market value that is determined by local assessors to be the total taxable value of land and additions on the property. | Land | Improvement |
|---|---|---|---|---|
| 2025 | $950 | $289,983 | $44,285 | $245,698 |
| 2024 | $5,879 | $268,067 | $0 | $0 |
| 2023 | $950 | $243,697 | $0 | $0 |
| 2022 | $5,192 | $221,543 | $0 | $0 |
| 2021 | $5,048 | $201,403 | $23,512 | $177,891 |
| 2020 | $5,136 | $195,713 | $23,512 | $172,201 |
| 2019 | $5,374 | $203,569 | $22,728 | $180,841 |
| 2018 | $4,547 | $195,736 | $22,728 | $173,008 |
| 2017 | $4,102 | $183,044 | $22,728 | $160,316 |
| 2016 | $3,729 | $177,703 | $22,728 | $154,975 |
| 2015 | $2,196 | $136,179 | $7,576 | $128,603 |
| 2014 | $2,340 | $127,356 | $9,470 | $117,886 |
Source: Public Records
Map
Nearby Homes
- 4604 Bello Vista Cir
- 4517 Playa Ct
- 4605 Dripping Spring Rd
- TBD 1 Dripping Spring Rd
- 30 Tananger Springs Dr
- 2025 Woodlake Rd
- 376 Tananger Springs Dr
- 5585 S Fannin Ave
- 918 Cleve Cole
- 257 Russell Ln
- 327 Russell Ln
- 461 Cleve Cole Rd
- 4813 Pinnacle Place
- 486 Cleve Cole Rd
- 3426 Tomahawk Dr
- 3417 Tomahawk Dr
- 3413 Tomahawk Dr
- 3422 Tomahawk Dr
- 3409 Tomahawk Dr
- 3405 Tomahawk Dr
- 4500 Arroyo Trail
- 4508 Arroyo Trail
- 5505 Arroyo Trail
- 4505 Arroyo Trail
- 4509 Arroyo Trail
- 4501 Arroyo Trail
- 5516 Arroyo Trail
- 5508 Arroyo Trail
- 4505 Vista Lagos Dr
- 5512 Arroyo Trail
- 4509 Vista Lagos Dr
- 5325 Arroyo Trail
- 4513 Arroyo Trail
- 5504 Arroyo Trail
- 4416 Woodlawn Rd
- 4412 Woodlawn Rd
- 4516 Arroyo Trail
- 4408 Woodlawn Rd
- 4500 Woodlawn Rd
- 4517 Vista Lagos Dr