
Estimated payment $3,887/month
Highlights
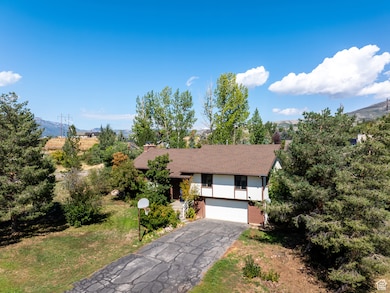
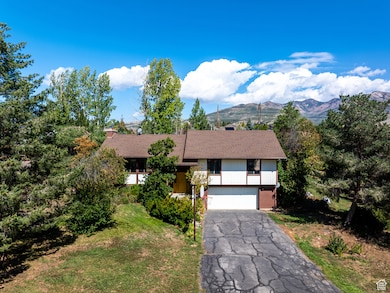
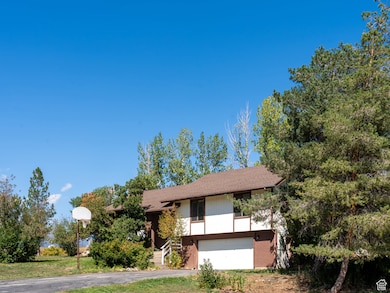
- Mature Trees
- Mountain View
- 2 Fireplaces
- Valley Elementary School Rated A-
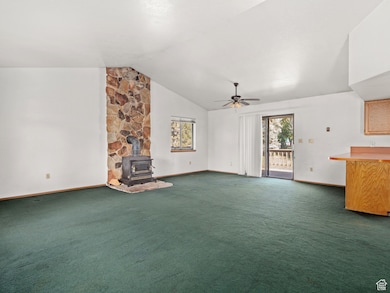
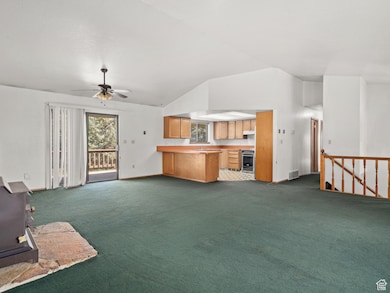
- Vaulted Ceiling
- No HOA
About This Home
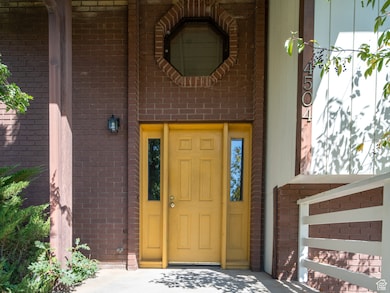
Opportunity knocks with this split-level home in a highly desirable neighborhood. Surrounded by mature trees and offering great views of Nordic Valley Ski Area and surrounding mountains this property provides privacy, shade, and a spacious yard with plenty of room to garden, expand, or entertain. Open space on the east side of the property. Located in a great neighborhood, the home features vaulted ceilings, a dramatic floor-to-ceiling stone fireplace, and large windows that fill the space with natural light and abundance of storage. The kitchen offers warm oak cabinetry, ample counter space, and a breakfast bar-ready for a modern refresh to unlock its full potential. A new roof was installed in May of 2024, providing peace of mind and added value for years to come. Whether you're an investor or a homeowner ready to personalize your space, this property offers great potential in a location that's hard to beat. All property information, boundaries and documents to be verified by buyer.
Home Details
Home Type
- Single Family
Est. Annual Taxes
- $3,315
Year Built
- Built in 1984
Lot Details
- 0.6 Acre Lot
- Landscaped
- Mature Trees
- Property is zoned Single-Family, A-1
Parking
- 2 Car Attached Garage
Property Views
- Mountain
- Valley
Home Design
- Split Level Home
- Brick Exterior Construction
- Composition Roof
Interior Spaces
- 2,206 Sq Ft Home
- 2-Story Property
- Vaulted Ceiling
- Ceiling Fan
- 2 Fireplaces
- Includes Fireplace Accessories
- Double Pane Windows
- Window Treatments
- Sliding Doors
- Fire and Smoke Detector
- Free-Standing Range
Flooring
- Carpet
- Linoleum
Bedrooms and Bathrooms
- 4 Bedrooms | 3 Main Level Bedrooms
Laundry
- Dryer
- Washer
Basement
- Partial Basement
- Exterior Basement Entry
Schools
- Valley Elementary School
- Snowcrest Middle School
- Weber High School
Utilities
- Forced Air Heating and Cooling System
- Natural Gas Connected
- Private Water Source
- Septic Tank
Community Details
- No Home Owners Association
- Eden Hills Subdivision
Listing and Financial Details
- Exclusions: Microwave
- Assessor Parcel Number 22-074-0016
Map
Home Values in the Area
Average Home Value in this Area
Tax History
| Year | Tax Paid | Tax Assessment Tax Assessment Total Assessment is a certain percentage of the fair market value that is determined by local assessors to be the total taxable value of land and additions on the property. | Land | Improvement |
|---|---|---|---|---|
| 2025 | $3,246 | $606,371 | $250,349 | $356,022 |
| 2024 | $2,978 | $311,849 | $132,205 | $179,644 |
| 2023 | $3,045 | $314,850 | $126,581 | $188,269 |
| 2022 | $2,869 | $302,016 | $104,601 | $197,415 |
| 2021 | $2,070 | $366,341 | $150,159 | $216,182 |
| 2020 | $2,063 | $335,276 | $130,191 | $205,085 |
| 2019 | $1,955 | $303,992 | $115,061 | $188,931 |
| 2018 | $1,907 | $284,346 | $115,061 | $169,285 |
| 2017 | $1,801 | $261,272 | $100,028 | $161,244 |
| 2016 | $1,676 | $131,766 | $49,482 | $82,284 |
| 2015 | $1,513 | $117,397 | $49,482 | $67,915 |
| 2014 | $1,537 | $116,600 | $49,482 | $67,118 |
Property History
| Date | Event | Price | List to Sale | Price per Sq Ft |
|---|---|---|---|---|
| 11/09/2025 11/09/25 | Pending | -- | -- | -- |
| 10/27/2025 10/27/25 | Price Changed | $685,000 | -1.4% | $311 / Sq Ft |
| 08/11/2025 08/11/25 | For Sale | $695,000 | -- | $315 / Sq Ft |
Purchase History
| Date | Type | Sale Price | Title Company |
|---|---|---|---|
| Interfamily Deed Transfer | -- | -- | |
| Interfamily Deed Transfer | -- | Mountain View Title | |
| Interfamily Deed Transfer | -- | Mountain View Title | |
| Interfamily Deed Transfer | -- | -- | |
| Warranty Deed | -- | Mountain View Title |
Mortgage History
| Date | Status | Loan Amount | Loan Type |
|---|---|---|---|
| Open | $145,600 | No Value Available | |
| Closed | $143,355 | No Value Available |
Source: UtahRealEstate.com
MLS Number: 2104449
APN: 22-074-0016
Disclaimer: Certain information contained herein is derived from information provided by parties other than Homes.com. All information provided is deemed reliable, but is not guaranteed to be accurate and should be independently verified.
![]() IDX information is provided exclusively for consumers’ personal, non-commercial use, that it may not be used for any purpose other than to identify prospective properties consumers may be interested in purchasing, and that the data is deemed reliable but is not guaranteed accurate by the MLS. Licensor is only providing the MLS Content and not other sources of data provided in the Product.
IDX information is provided exclusively for consumers’ personal, non-commercial use, that it may not be used for any purpose other than to identify prospective properties consumers may be interested in purchasing, and that the data is deemed reliable but is not guaranteed accurate by the MLS. Licensor is only providing the MLS Content and not other sources of data provided in the Product.
Based on information from the Wasatch Front Regional Multiple Listing Service, Inc.. All data, including all measurements and calculations of area, is obtained from various sources and has not been, and will not be, verified by broker or the MLS. All information should be independently reviewed and verified for accuracy. Properties may or may not be listed by the office/agent presenting the information.
- 3425 Fuller Dr
- 3710 N Foothill Ln
- 3700 N Foothill Ln
- 3727 N Patio Springs Cir
- 3510 N Willow Creek Ln Unit 9
- 3503 N Willow Creek Ln
- 3858 E Eagle Ct
- 3480 N 5100 E
- 3674 N Willow Brooke Ln
- 3615 N Wolf Lodge Dr Unit 211
- 3615 N Wolf Lodge Dr Unit 402
- 3615 N Wolf Lodge Dr Unit 103
- 3615 N Wolf Dr Unit 309
- 3615 N Wolf Lodge Dr Unit 1401
- 3615 N Wolf Lodge Dr Unit 807
- 3615 N Wolf Lodge Dr Unit 805
- 3615 N Wolf Dr Unit 804
- 3521 N Fox Run Unit 811
- 3615 N Wolf Creek Dr Unit 709
- 3780 N Willow Brooke Ln
