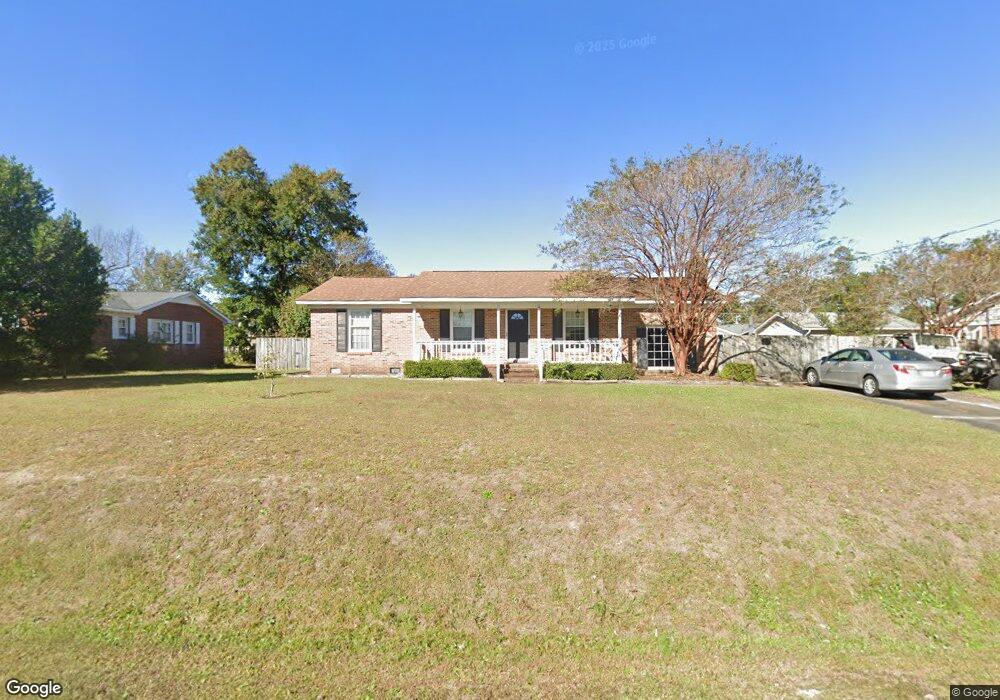
4505 Blueberry Rd Wilmington, NC 28405
Estimated Value: $352,615 - $374,000
3
Beds
2
Baths
1,458
Sq Ft
$250/Sq Ft
Est. Value
About This Home
This home is located at 4505 Blueberry Rd, Wilmington, NC 28405 and is currently estimated at $364,654, approximately $250 per square foot. 4505 Blueberry Rd is a home located in New Hanover County with nearby schools including Wrightsboro Elementary School, Emma B. Trask Middle School, and Emsley A. Laney High School.
Ownership History
Date
Name
Owned For
Owner Type
Purchase Details
Closed on
Mar 13, 2009
Sold by
Aop Llc
Bought by
Workman Mark A
Current Estimated Value
Purchase Details
Closed on
Dec 19, 2008
Sold by
Kloppe Gerald L and Kloppe Bonnie K
Bought by
Aop Llc
Purchase Details
Closed on
Jun 9, 2004
Sold by
Kloppe Gerald Bonnie
Bought by
Kloppe Gerald Bonnie Rev Trust
Purchase Details
Closed on
Sep 8, 1998
Sold by
Southern Connection Limited
Bought by
Kloppe Gerald Bonnie
Purchase Details
Closed on
Jun 17, 1998
Sold by
Doug Pollard Inc
Bought by
Southern Connection Limited
Purchase Details
Closed on
May 14, 1998
Sold by
Jackson Edward B Deborah S
Bought by
Doug Pollard Inc
Purchase Details
Closed on
Dec 1, 1975
Bought by
Jackson Edward B Deborah S
Create a Home Valuation Report for This Property
The Home Valuation Report is an in-depth analysis detailing your home's value as well as a comparison with similar homes in the area
Home Values in the Area
Average Home Value in this Area
Purchase History
| Date | Buyer | Sale Price | Title Company |
|---|---|---|---|
| Workman Mark A | $150,000 | None Available | |
| Aop Llc | -- | None Available | |
| Kloppe Gerald Bonnie Rev Trust | -- | -- | |
| Kloppe Gerald Bonnie | $21,000 | -- | |
| Southern Connection Limited | $115,000 | -- | |
| Doug Pollard Inc | $75,000 | -- | |
| Jackson Edward B Deborah S | $35,900 | -- |
Source: Public Records
Tax History Compared to Growth
Tax History
| Year | Tax Paid | Tax Assessment Tax Assessment Total Assessment is a certain percentage of the fair market value that is determined by local assessors to be the total taxable value of land and additions on the property. | Land | Improvement |
|---|---|---|---|---|
| 2025 | $1,408 | $352,600 | $118,000 | $234,600 |
| 2024 | $1,162 | $208,300 | $65,400 | $142,900 |
| 2023 | $1,162 | $208,300 | $65,400 | $142,900 |
| 2022 | $1,167 | $208,300 | $65,400 | $142,900 |
| 2021 | $1,152 | $208,300 | $65,400 | $142,900 |
| 2020 | $1,008 | $159,400 | $40,000 | $119,400 |
| 2019 | $1,008 | $159,400 | $40,000 | $119,400 |
| 2018 | $1,008 | $159,400 | $40,000 | $119,400 |
| 2017 | $1,032 | $159,400 | $40,000 | $119,400 |
| 2016 | $952 | $137,400 | $40,000 | $97,400 |
| 2015 | $885 | $137,400 | $40,000 | $97,400 |
| 2014 | $870 | $137,400 | $40,000 | $97,400 |
Source: Public Records
Map
Nearby Homes
- 1933 N Kerr Ave
- 136 Blount Dr
- 129 Elder Dr
- 1571 Grey Cliff Run
- 141 Hargrove Dr
- 2035 N Kerr Ave
- 1658 Killdeer Ln
- 318 Springdale Dr
- 3628 Calabash Ct
- 1508 Dove Shell Way
- 314 Brookfield Dr
- 4829 Gordon Rd
- 4826 Castleboro Ct
- 4844 Acres Dr
- 402 Governors Rd
- 4905 Tupelo Dr
- 2608 Hargate Ct
- 814 Bay Blossom Dr
- 5000 Sun Coast Dr
- 2509 N Kerr Ave
- 4509 Blueberry Rd
- 4501 Blueberry Rd Unit LT57
- 1858 Brierwood Rd
- 1854 Brierwood Rd
- 4506 Blueberry Rd
- 1830 Blackberry Rd
- 4510 Blueberry Rd
- 1848 Brierwood Rd
- 1842 Loganberry Rd
- 1846 Loganberry Rd
- 1850 Loganberry Rd
- 1831 Blackberry Rd
- 1855 Loganberry Rd
- 1826 Blackberry Rd
- 1854 Loganberry Rd
- 4425 Huckleberry Rd
- 1844 Brierwood Rd
- 4415 Raspberry Rd
- 1859 Loganberry Rd
- 1858 Loganberry Rd