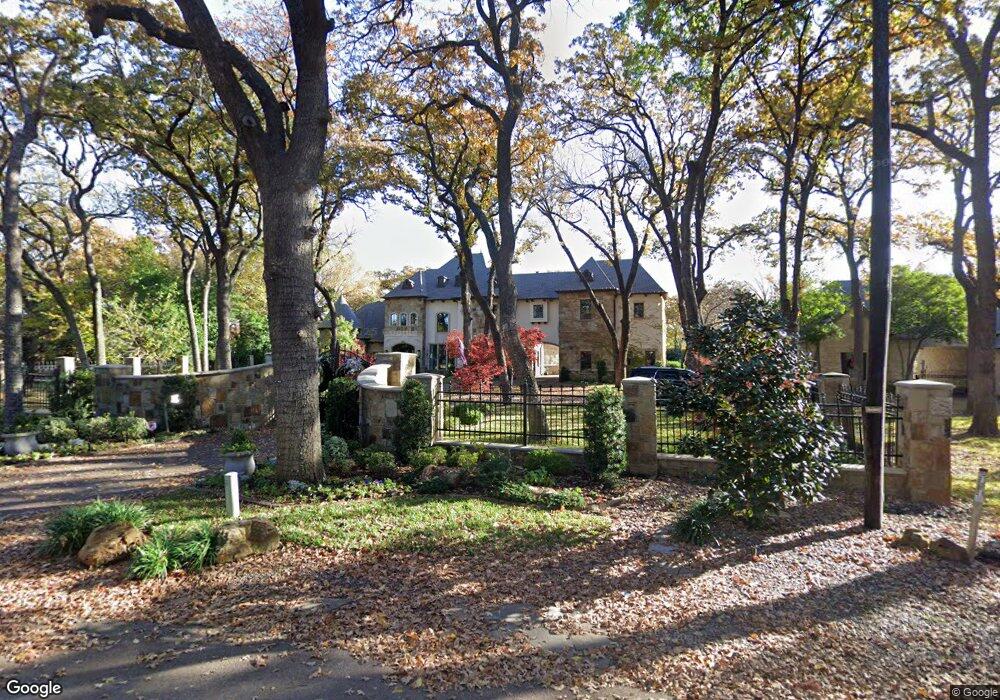
4505 Bowman Dr Colleyville, TX 76034
Estimated Value: $2,522,000 - $2,941,000
4
Beds
7
Baths
7,056
Sq Ft
$378/Sq Ft
Est. Value
About This Home
This home is located at 4505 Bowman Dr, Colleyville, TX 76034 and is currently estimated at $2,664,247, approximately $377 per square foot. 4505 Bowman Dr is a home located in Tarrant County with nearby schools including Bransford Elementary School, Colleyville Middle School, and Waypoint Montessori.
Ownership History
Date
Name
Owned For
Owner Type
Purchase Details
Closed on
Nov 11, 2022
Sold by
Deneui Daniel and Deneui Terri
Bought by
Deneui Living Trust
Current Estimated Value
Purchase Details
Closed on
Jan 27, 2014
Sold by
Hilderbrand Phillip John and Hilderbrand Wendy Kay
Bought by
Deneui Daniel and Deneui Suresh Terri
Home Financials for this Owner
Home Financials are based on the most recent Mortgage that was taken out on this home.
Original Mortgage
$1,462,500
Interest Rate
5%
Mortgage Type
Adjustable Rate Mortgage/ARM
Purchase Details
Closed on
Jul 8, 2008
Sold by
Lawler Patrick E and Lawler Kim G
Bought by
Hildebrand Phillip John and Hildebrand Wendy Kay
Home Financials for this Owner
Home Financials are based on the most recent Mortgage that was taken out on this home.
Original Mortgage
$1,750,000
Interest Rate
6.37%
Mortgage Type
Purchase Money Mortgage
Purchase Details
Closed on
Jul 16, 2004
Sold by
Chatman Keith and Stites Kelye
Bought by
Lawler Patrick E and Lawler Kim G
Home Financials for this Owner
Home Financials are based on the most recent Mortgage that was taken out on this home.
Original Mortgage
$185,268
Interest Rate
6.32%
Mortgage Type
Purchase Money Mortgage
Create a Home Valuation Report for This Property
The Home Valuation Report is an in-depth analysis detailing your home's value as well as a comparison with similar homes in the area
Home Values in the Area
Average Home Value in this Area
Purchase History
| Date | Buyer | Sale Price | Title Company |
|---|---|---|---|
| Deneui Living Trust | -- | -- | |
| Deneui Daniel | $1,740,719 | Stnt | |
| Hildebrand Phillip John | -- | Hexter Fair Title Company | |
| Lawler Patrick E | -- | -- |
Source: Public Records
Mortgage History
| Date | Status | Borrower | Loan Amount |
|---|---|---|---|
| Previous Owner | Deneui Daniel | $1,462,500 | |
| Previous Owner | Hildebrand Phillip John | $1,750,000 | |
| Previous Owner | Lawler Patrick E | $185,268 |
Source: Public Records
Tax History Compared to Growth
Tax History
| Year | Tax Paid | Tax Assessment Tax Assessment Total Assessment is a certain percentage of the fair market value that is determined by local assessors to be the total taxable value of land and additions on the property. | Land | Improvement |
|---|---|---|---|---|
| 2025 | $6,920 | $2,258,626 | $378,430 | $1,880,196 |
| 2024 | $6,920 | $2,311,139 | $378,430 | $1,932,709 |
| 2023 | $38,123 | $2,260,000 | $378,430 | $1,881,570 |
| 2022 | $27,741 | $1,909,623 | $378,430 | $1,531,193 |
| 2021 | $28,042 | $1,290,504 | $353,430 | $937,074 |
| 2020 | $25,795 | $1,160,835 | $353,430 | $807,405 |
| 2019 | $34,257 | $1,481,717 | $353,430 | $1,128,287 |
| 2018 | $8,965 | $1,508,028 | $353,430 | $1,154,598 |
| 2017 | $36,018 | $1,524,600 | $347,879 | $1,176,721 |
| 2016 | $33,918 | $1,435,711 | $351,930 | $1,083,781 |
| 2015 | $40,554 | $1,750,000 | $135,620 | $1,614,380 |
| 2014 | $40,554 | $2,316,400 | $135,620 | $2,180,780 |
Source: Public Records
Map
Nearby Homes
- 1916 Renfro Rd
- 4612 Bill Simmons Rd
- 4816 Bill Simmons Rd
- 4723 Bill Simmons Rd
- 2001 Oak Knoll Dr
- 3216 Glade Rd
- 2201 Oak Knoll Ct
- 4600 Stafford Dr
- 4309 Meandering Way
- 3907 Windermere Dr
- 2204 Woodstock Dr
- 1421 Plantation Dr N
- 4812 Carmel Place
- 1303 Crest Dr
- 4516 Dartmoore Ln
- 5104 Preservation Ave
- 5404 Miramar Ln
- 3813 Brookridge Ct
- 3827 Ashbury Ln
- 5200 Preservation Ave
- 4501 Bowman Dr
- 4509 Bowman Dr
- 2001 Renfro Rd
- 4413 Bowman Dr
- 4504 Bowman Dr
- 1915 Renfro Rd
- 4500 Bowman Dr
- 4412 Bowman Dr
- 2000 Renfro Rd
- 4409 Bowman Dr
- 1907 Renfro Rd
- 1900 Tyler St
- 2108 Oak Knoll Dr
- 4407 Bowman Dr
- 4408 Bowman Dr
- 1908 Renfro Rd
- 4508 Bill Simmons Rd
- 4504 Bill Simmons Rd
- 1865 Renfro Rd
- 4604 Bill Simmons Rd