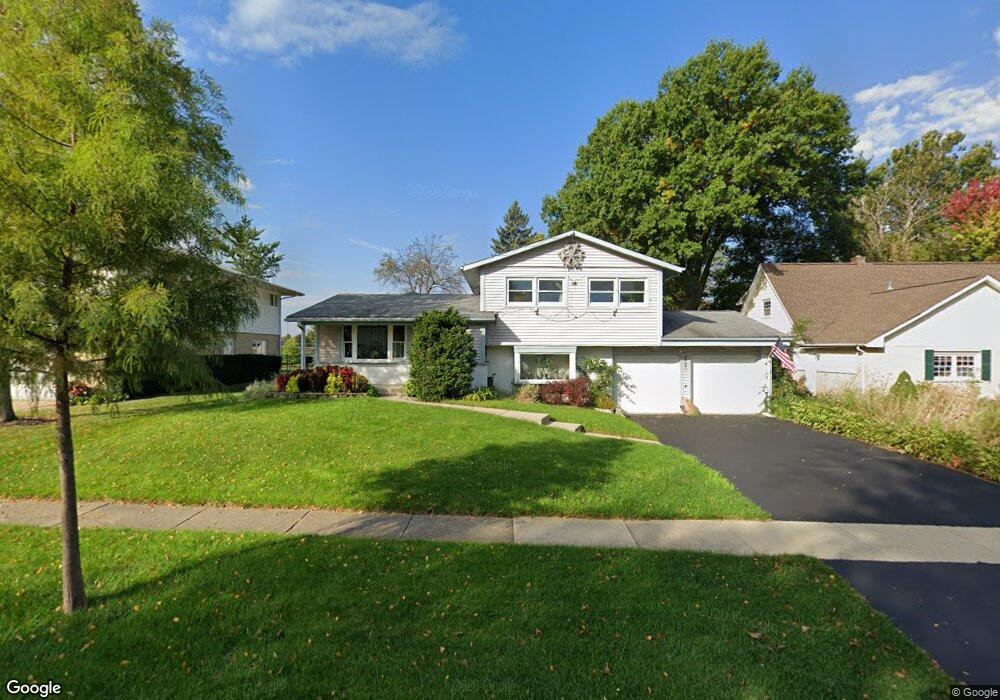
4505 Magnolia Dr Unit 4 Rolling Meadows, IL 60008
Busse Woods NeighborhoodEstimated Value: $428,000 - $485,000
4
Beds
3
Baths
2,036
Sq Ft
$223/Sq Ft
Est. Value
About This Home
This home is located at 4505 Magnolia Dr Unit 4, Rolling Meadows, IL 60008 and is currently estimated at $454,898, approximately $223 per square foot. 4505 Magnolia Dr Unit 4 is a home located in Cook County with nearby schools including Willow Bend Elementary School, Carl Sandburg Junior High School, and Rolling Meadows High School.
Ownership History
Date
Name
Owned For
Owner Type
Purchase Details
Closed on
Dec 19, 1997
Sold by
Loch David J and Judd Bradley S
Bought by
Hubbard Mark S and Lockwood Jeffrey N
Current Estimated Value
Home Financials for this Owner
Home Financials are based on the most recent Mortgage that was taken out on this home.
Original Mortgage
$147,000
Outstanding Balance
$22,321
Interest Rate
7.24%
Estimated Equity
$432,577
Purchase Details
Closed on
Mar 3, 1997
Sold by
Hayden Anthony J and Hayden Gillian J
Bought by
Loch Dave J and Judd Bradley S
Home Financials for this Owner
Home Financials are based on the most recent Mortgage that was taken out on this home.
Original Mortgage
$131,400
Interest Rate
5.75%
Create a Home Valuation Report for This Property
The Home Valuation Report is an in-depth analysis detailing your home's value as well as a comparison with similar homes in the area
Home Values in the Area
Average Home Value in this Area
Purchase History
| Date | Buyer | Sale Price | Title Company |
|---|---|---|---|
| Hubbard Mark S | $177,000 | -- | |
| Loch Dave J | $146,000 | -- |
Source: Public Records
Mortgage History
| Date | Status | Borrower | Loan Amount |
|---|---|---|---|
| Open | Hubbard Mark S | $147,000 | |
| Previous Owner | Loch Dave J | $131,400 |
Source: Public Records
Tax History
| Year | Tax Paid | Tax Assessment Tax Assessment Total Assessment is a certain percentage of the fair market value that is determined by local assessors to be the total taxable value of land and additions on the property. | Land | Improvement |
|---|---|---|---|---|
| 2025 | $8,252 | $42,000 | $7,558 | $34,442 |
| 2024 | $8,252 | $28,009 | $6,365 | $21,644 |
| 2023 | $7,858 | $31,000 | $6,365 | $24,635 |
| 2022 | $7,858 | $31,000 | $6,365 | $24,635 |
| 2021 | $5,713 | $21,339 | $4,176 | $17,163 |
| 2020 | $5,866 | $21,339 | $4,176 | $17,163 |
| 2019 | $6,435 | $25,669 | $4,176 | $21,493 |
| 2018 | $7,845 | $27,769 | $3,580 | $24,189 |
| 2017 | $7,705 | $27,769 | $3,580 | $24,189 |
| 2016 | $7,435 | $27,769 | $3,580 | $24,189 |
| 2015 | $6,904 | $24,662 | $3,182 | $21,480 |
| 2014 | $6,757 | $24,662 | $3,182 | $21,480 |
| 2013 | $6,576 | $24,662 | $3,182 | $21,480 |
Source: Public Records
Map
Nearby Homes
- 2830 Northampton Dr Unit A1
- 5001 Carriageway Dr Unit 215
- 5000 Carriageway Dr Unit 305
- 5000 Carriageway Dr Unit 315
- 399 Knollwood Ct
- 1813 Hemlock Place Unit 311
- 4980 Kimball Hill Dr Unit C2
- 2504 Algonquin Rd Unit 14
- 3200 Thrush Ln
- 3710 Meadow Dr
- 3712 Jay Ln
- 2402 Algonquin Rd Unit 9
- 1931 Prairie Square Unit 1931
- 1912 Prairie Square Unit 309
- 2302 Fulle St
- 1926 Prairie Square Unit 210
- 3345 Kirchoff Rd Unit 5C
- 3605 Oriole Ln
- 3135 Town Square Dr Unit 401
- 3135 Town Square Dr Unit 104
- 4503 Magnolia Dr
- 4507 Magnolia Dr
- 4502 Sycamore Ln
- 4501 Magnolia Dr
- 4504 Sycamore Ln
- 4500 Sycamore Ln
- 4509 Magnolia Dr
- 4600 Sycamore Ln
- 4504 Magnolia Dr
- 4502 Magnolia Dr Unit 4
- 4407 Magnolia Dr
- 4506 Magnolia Dr
- 4406 Sycamore Ln
- 3904 E Frontage Rd
- 4500 Magnolia Dr Unit 4
- 4602 Sycamore Ln
- 4601 Magnolia Dr
- 4404 Sycamore Ln
- 4600 Magnolia Dr
- 4405 Magnolia Dr
Your Personal Tour Guide
Ask me questions while you tour the home.