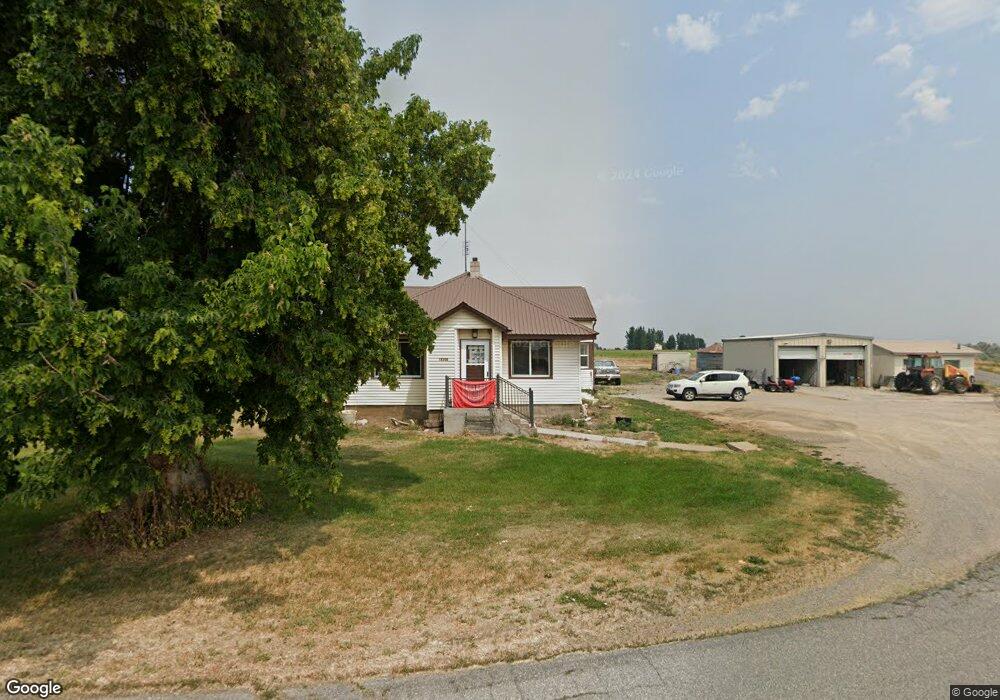
4505 W 12300 St N Cornish, UT 84308
Estimated Value: $317,304 - $378,000
--
Bed
--
Bath
1,669
Sq Ft
$209/Sq Ft
Est. Value
About This Home
This home is located at 4505 W 12300 St N, Cornish, UT 84308 and is currently estimated at $349,576, approximately $209 per square foot. 4505 W 12300 St N is a home with nearby schools including Lewiston School, White Pine Middle School, and North Cache Middle School.
Ownership History
Date
Name
Owned For
Owner Type
Purchase Details
Closed on
Jan 19, 2016
Sold by
Fisher L Brad and Fisher Lynn Anne
Bought by
Fisher L Brad and L Brad Fisher Trust
Current Estimated Value
Home Financials for this Owner
Home Financials are based on the most recent Mortgage that was taken out on this home.
Original Mortgage
$141,600
Interest Rate
3.9%
Mortgage Type
Credit Line Revolving
Purchase Details
Closed on
Jan 11, 2016
Sold by
Fisher L Brad and L Brad Fisher Trust
Bought by
Fisher L Brad and Fisher Lynn Anne
Home Financials for this Owner
Home Financials are based on the most recent Mortgage that was taken out on this home.
Original Mortgage
$141,600
Interest Rate
3.9%
Mortgage Type
Credit Line Revolving
Purchase Details
Closed on
Nov 19, 2007
Sold by
Fisher L Brad and L Brad Fisher Trust
Bought by
Fisher L Brad and L Brad Fisher Trust
Create a Home Valuation Report for This Property
The Home Valuation Report is an in-depth analysis detailing your home's value as well as a comparison with similar homes in the area
Home Values in the Area
Average Home Value in this Area
Purchase History
| Date | Buyer | Sale Price | Title Company |
|---|---|---|---|
| Fisher L Brad | -- | Hickman Land Title Co | |
| Fisher L Brad | -- | Hickman Land Title Company | |
| Fisher L Brad | -- | American Secure Title |
Source: Public Records
Mortgage History
| Date | Status | Borrower | Loan Amount |
|---|---|---|---|
| Closed | Fisher L Brad | $141,600 |
Source: Public Records
Tax History Compared to Growth
Tax History
| Year | Tax Paid | Tax Assessment Tax Assessment Total Assessment is a certain percentage of the fair market value that is determined by local assessors to be the total taxable value of land and additions on the property. | Land | Improvement |
|---|---|---|---|---|
| 2025 | $1,830 | $233,060 | $0 | $0 |
| 2024 | $1,442 | $166,245 | $0 | $0 |
| 2023 | $1,514 | $165,965 | $0 | $0 |
| 2022 | $1,580 | $168,440 | $0 | $0 |
| 2021 | $1,519 | $228,699 | $70,250 | $158,449 |
| 2020 | $1,421 | $197,922 | $70,250 | $127,672 |
| 2019 | $1,309 | $169,922 | $42,250 | $127,672 |
| 2018 | $1,215 | $156,650 | $42,250 | $114,400 |
| 2017 | $1,204 | $92,435 | $0 | $0 |
| 2016 | $1,219 | $92,435 | $0 | $0 |
| 2015 | $1,219 | $92,435 | $0 | $0 |
| 2014 | $1,345 | $104,150 | $0 | $0 |
| 2013 | -- | $104,150 | $0 | $0 |
Source: Public Records
Map
Nearby Homes
- 4405 W 13400 N
- 77 N 100 W
- 545 N 1600 W
- 1317 S 400 E
- 4650 S 1400 W
- 6350 W 9000 N
- 80 W 300 S
- 1120 S 800 W
- 1074 S 800 W
- 50 W 300 S
- 338 E 1600 S
- 435 E 1600 S Unit EAST
- 12506 N 525 E Unit 6
- 12489 N 525 E
- 12455 N 525 E Unit 1
- 12455 N 525 E
- 12506 N 525 E
- 12484 N 525 E Unit 7
- 12521 N 525 E
- 12518 N 525 E Unit 5